Answered step by step
Verified Expert Solution
Link Copied!

Question

1 Approved Answer

(b) Figure 1 shows the phase diagram of binary alloy Cu-Ni. 20 40 60 80 100 1600 2800 15001 Liquid 2600 1400 2400 Temperature C
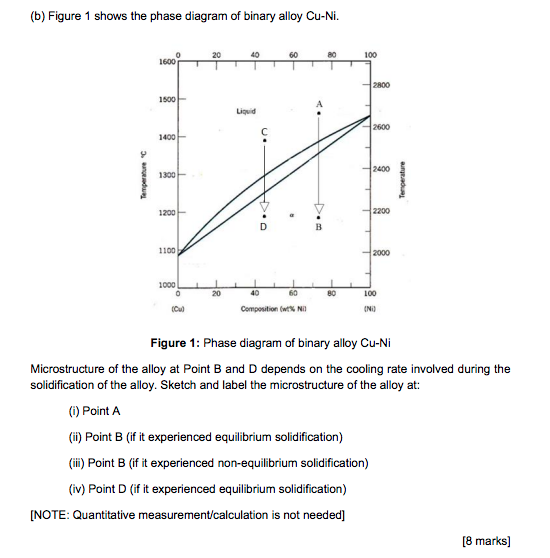
image text in transcribed

(b) Figure 1 shows the phase diagram of binary alloy Cu-Ni. 20 40 60 80 100 1600 2800 15001 Liquid 2600 1400 2400 Temperature C 1300 Temperature 1 1200 2200 B 1100 2000 1000 0 20 40 60 80 100 Cu Composition will NO IND Figure 1: Phase diagram of binary alloy Cu-Ni Microstructure of the alloy at Point B and D depends on the cooling rate involved during the solidification of the alloy. Sketch and label the microstructure of the alloy at: (1) Point A (ii) Point B (if it experienced equilibrium solidification) (ii) Point B (if it experienced non-equilibrium solidification) (iv) Point D (if it experienced equilibrium solidification) [NOTE: Quantitative measurement/calculation is not needed] [8 marks)

Step by Step Solution

There are 3 Steps involved in it

Step: 1

blur-text-image

Get Instant Access to Expert-Tailored Solutions

See step-by-step solutions with expert insights and AI powered tools for academic success

Step: 2

blur-text-image

Step: 3

blur-text-image

Ace Your Homework with AI

Get the answers you need in no time with our AI-driven, step-by-step assistance

Get Started

Recommended Textbook for

Macroscale And Microscale Organic Experiments

Authors: Kenneth L Williamson, Robert Minard, Katherine M Masters

5th Edition

0618590676, 9780618590674

More Books

Students also viewed these Chemistry questions

Question

1. Which is the most abundant gas presented in the atmosphere?

Answered: 1 week ago

Question

They are purely a set of perceptions, not fact.

Answered: 1 week ago