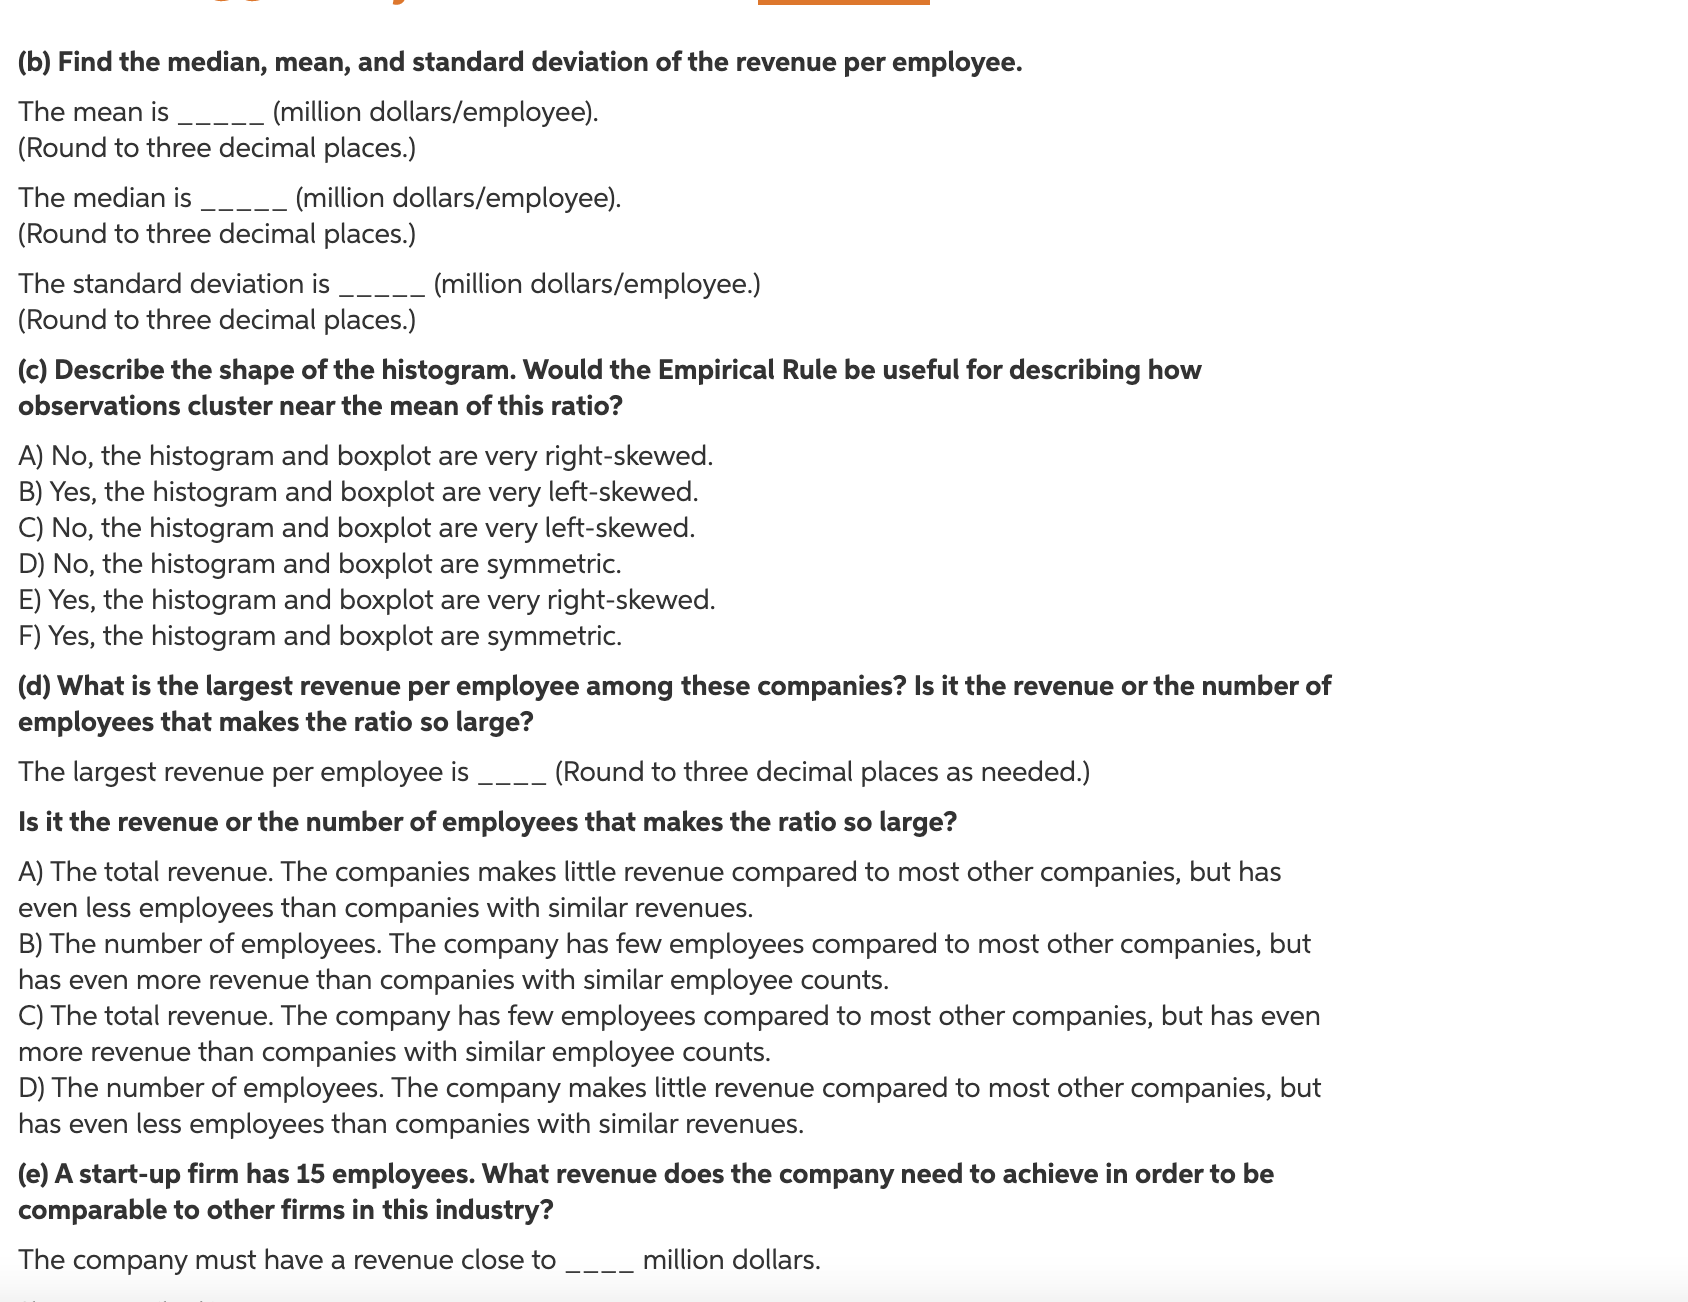
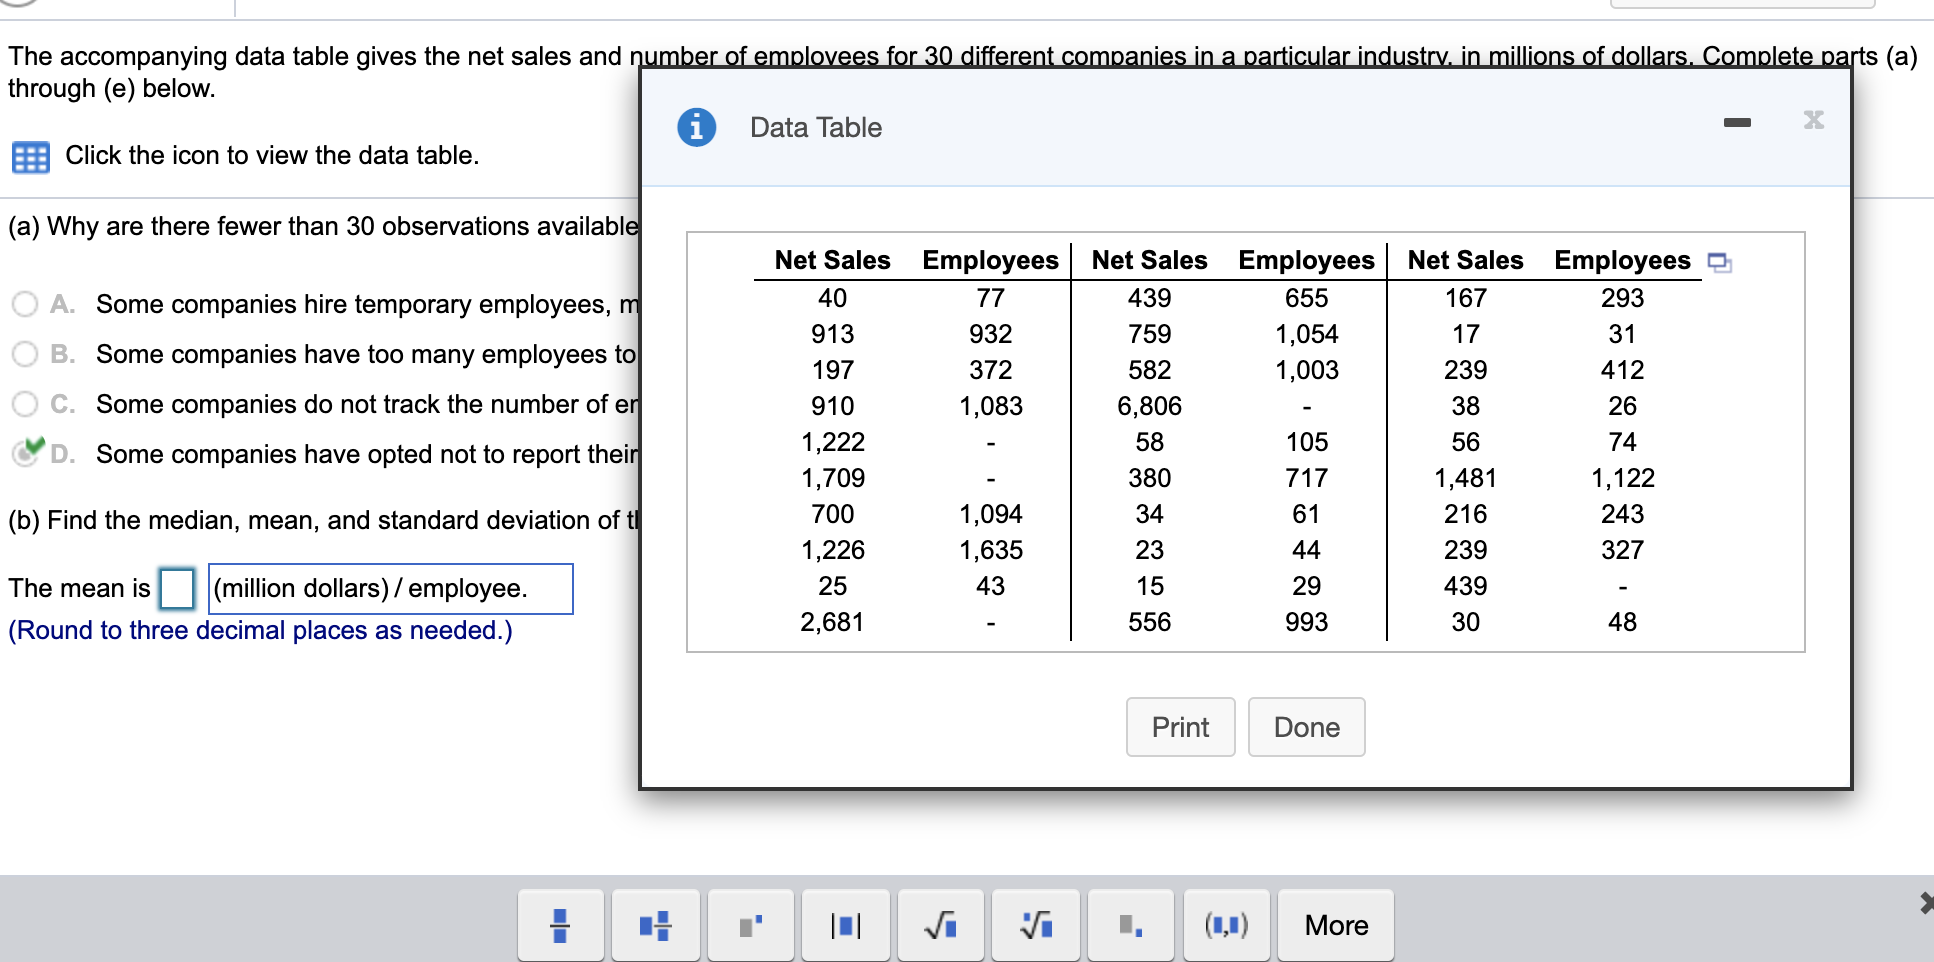
(b) Find the median, mean, and standard deviation of the revenue per employee. The mean is _____ (million dollars/employee). (Round to three decimal places.) The median is _____ (million dollars/employee). (Round to three decimal places.) The standard deviation is _____ (million dollars/employee.) (Round to three decimal places.) (c) Describe the shape of the histogram. Would the Empirical Rule be useful for describing how observations cluster near the mean of this ratio? A) No, the histogram and boxplot are very right-skewed. B) Yes, the histogram and boxplot are very left-skewed. C) No, the histogram and boxplot are very left-skewed. D) No, the histogram and boxplot are symmetric. E) Yes, the histogram and boxplot are very right-skewed. F) Yes, the histogram and boxplot are symmetric. (d) What is the largest revenue per employee among these companies? Is it the revenue or the number of employees that makes the ratio so large? The largest revenue per employee is ____ (Round to three decimal places as needed.) Is it the revenue or the number of employees that makes the ratio so large? A) The total revenue. The companies makes little revenue compared to most other companies, but has even less employees than companies with similar revenues. B) The number of employees. The company has few employees compared to most other companies, but has even more revenue than companies with similar employee counts. C) The total revenue. The company has few employees compared to most other companies, but has even more revenue than companies with similar employee counts. D) The number of employees. The company makes little revenue compared to most other companies, but has even less employees than companies with similar revenues. (e) A start-up firm has 15 employees. What revenue does the company need to achieve in order to be comparable to other firms in this industry? The company must have a revenue close to ____ million dollars. The accompanying data table gives the net sales and number of employees for 30 different companies in a particular industry, in millions of dollars, Complete parts (a) through (e) below. Data Table X Click the icon to view the data table. (a) Why are there fewer than 30 observations available Net Sales Employees Net Sales Employees Net Sales Employees O A. Some companies hire temporary employees, m 40 77 439 655 167 293 O B. Some companies have too many employees to 913 932 759 1,054 17 31 197 372 582 1,003 239 412 O C. Some companies do not track the number of er 910 1,083 6,806 38 26 D. Some companies have opted not to report their 1,222 58 105 56 74 1,709 380 717 1,481 1, 122 (b) Find the median, mean, and standard deviation of t 700 1,094 34 61 216 243 1,226 1,635 23 44 239 327 The mean is (million dollars) / employee. 25 43 15 29 439 (Round to three decimal places as needed.) 2,681 556 993 30 48 Print Done 101 vi Vi More


