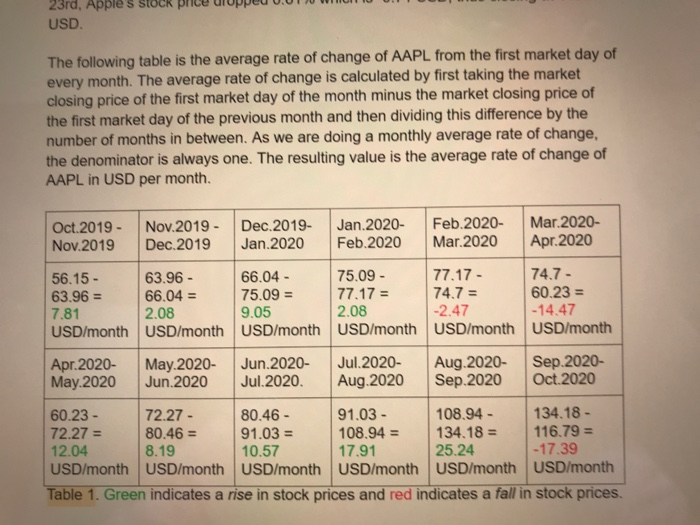
(b) Graphing the derivative In this section you will analyze the stock selected in part a) and create visual representations of important properties of the stock. Take your stock from part a) and look at its chart for the last month. On paper, sketch a curve to represent the graph of the rate of change of the stock value as a function of time. Remember that a sketch does not have to be 100% accurate (don't do any calculations!). Upload both a screenshot of the original chart and your new graph side by side. . Based on your new graph, when were the best times to buy or sell the stock? In plain language, explain to a stock trader what it means when your new graph crosses the x-axis. Also explain whether they should buy, sell, or hold, at those times 23rd, Apple s sto USD. The following table is the average rate of change of AAPL from the first market day of every month. The average rate of change is calculated by first taking the market closing price of the first market day of the month minus the market closing price of the first market day of the previous month and then dividing this difference by the number of months in between. As we are doing a monthly average rate of change, the denominator is always one. The resulting value is the average rate of change of AAPL in USD per month. Oct.2019 - Nov.2019 Nov.2019 - Dec. 2019 Dec.2019- Jan.2020 Jan.2020- Feb.2020 Feb.2020- Mar.2020 Mar.2020- Apr.2020 56.15 63.96 - 66.04 - 75.09 - 77.17 - 74.7 - 63.96 = 66.04 = 75.09 = 77.17 = 74.7 = 60.23 = 7.81 2.08 9.05 2.08 -2.47 - 14.47 USD/month USD/month USD/month USD/month USD/month USD/month Apr. 2020 May.2020 Jun.2020 Jul 2020 Aug 2020 Sep.2020- May.2020 Jun.2020 Jul.2020. Aug.2020 Sep.2020 Oct.2020 60.23 - 72.27 - 80.46 - 91.03 - 108.94 - 134.18 - 72.27 = 80.46 = 91.03 = 108.94 = 134.18 = 116.79 = 12.04 8.19 10.57 17.91 25.24 -17.39 USD/month USD/ month USD/month USD/month USD/month USD/month Table 1. Green indicates a rise in stock prices and red indicates a fall in stock prices. (b) Graphing the derivative In this section you will analyze the stock selected in part a) and create visual representations of important properties of the stock. Take your stock from part a) and look at its chart for the last month. On paper, sketch a curve to represent the graph of the rate of change of the stock value as a function of time. Remember that a sketch does not have to be 100% accurate (don't do any calculations!). Upload both a screenshot of the original chart and your new graph side by side. . Based on your new graph, when were the best times to buy or sell the stock? In plain language, explain to a stock trader what it means when your new graph crosses the x-axis. Also explain whether they should buy, sell, or hold, at those times 23rd, Apple s sto USD. The following table is the average rate of change of AAPL from the first market day of every month. The average rate of change is calculated by first taking the market closing price of the first market day of the month minus the market closing price of the first market day of the previous month and then dividing this difference by the number of months in between. As we are doing a monthly average rate of change, the denominator is always one. The resulting value is the average rate of change of AAPL in USD per month. Oct.2019 - Nov.2019 Nov.2019 - Dec. 2019 Dec.2019- Jan.2020 Jan.2020- Feb.2020 Feb.2020- Mar.2020 Mar.2020- Apr.2020 56.15 63.96 - 66.04 - 75.09 - 77.17 - 74.7 - 63.96 = 66.04 = 75.09 = 77.17 = 74.7 = 60.23 = 7.81 2.08 9.05 2.08 -2.47 - 14.47 USD/month USD/month USD/month USD/month USD/month USD/month Apr. 2020 May.2020 Jun.2020 Jul 2020 Aug 2020 Sep.2020- May.2020 Jun.2020 Jul.2020. Aug.2020 Sep.2020 Oct.2020 60.23 - 72.27 - 80.46 - 91.03 - 108.94 - 134.18 - 72.27 = 80.46 = 91.03 = 108.94 = 134.18 = 116.79 = 12.04 8.19 10.57 17.91 25.24 -17.39 USD/month USD/ month USD/month USD/month USD/month USD/month Table 1. Green indicates a rise in stock prices and red indicates a fall in stock prices