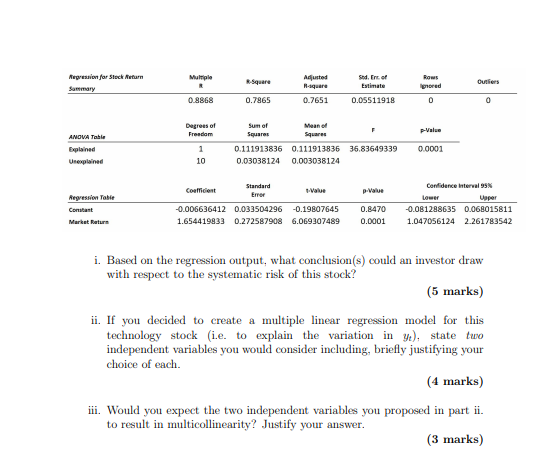
(b) Investors in stocks have different appetites for risk. Data on 12 monthly returns, y, of a technology stock are collected in parallel with monthly returns of the relevant market portfolio (representing a stock index), 11. According to the capital asset pricing model (CAPM), the relationship can be expressed as: yz = a + 8x + where a is the risk-free rate of return, B is the systematic risk i.e. the risk the stock shares with the market), and is the usual regression error term. The regression results are shown on the next page. Multiple Nepression for Stock Return Surimary R-Square Adjusted R-square Sud. Ent of Estimate Outliers prored 0.8868 0.7865 0.7651 0.05511918 0 0 Degrees of Sum of F p Valve Freedom Squares ANOVA Table Squares Explained 1 0.111913836 0.111913836 36.83649339 0.0001 Unexplained 10 0.03038124 0.003038124 Standard Confidence interval 95% Coefident p-value Error Regression Table Lower Upper Constant -0.006636412 0.033504296 -0.19807645 0.8470 -0.081288635 0.068015811 Market Return 1.654419833 0.272587908 6.069307489 0.0001 1.047056124 2.261783542 i. Based on the regression output, what conclusion(s) could an investor draw with respect to the systematic risk of this stock? (5 marks) ii. If you decided to create a multiple linear regression model for this technology stock (i.e. to explain the variation in y), state two independent variables you would consider including, briefly justifying your choice of each. (4 marks) iii. Would you expect the two independent variables you proposed in part ii. to result in multicollinearity? Justify your answer. (3 marks) (b) Investors in stocks have different appetites for risk. Data on 12 monthly returns, y, of a technology stock are collected in parallel with monthly returns of the relevant market portfolio (representing a stock index), 11. According to the capital asset pricing model (CAPM), the relationship can be expressed as: yz = a + 8x + where a is the risk-free rate of return, B is the systematic risk i.e. the risk the stock shares with the market), and is the usual regression error term. The regression results are shown on the next page. Multiple Nepression for Stock Return Surimary R-Square Adjusted R-square Sud. Ent of Estimate Outliers prored 0.8868 0.7865 0.7651 0.05511918 0 0 Degrees of Sum of F p Valve Freedom Squares ANOVA Table Squares Explained 1 0.111913836 0.111913836 36.83649339 0.0001 Unexplained 10 0.03038124 0.003038124 Standard Confidence interval 95% Coefident p-value Error Regression Table Lower Upper Constant -0.006636412 0.033504296 -0.19807645 0.8470 -0.081288635 0.068015811 Market Return 1.654419833 0.272587908 6.069307489 0.0001 1.047056124 2.261783542 i. Based on the regression output, what conclusion(s) could an investor draw with respect to the systematic risk of this stock? (5 marks) ii. If you decided to create a multiple linear regression model for this technology stock (i.e. to explain the variation in y), state two independent variables you would consider including, briefly justifying your choice of each. (4 marks) iii. Would you expect the two independent variables you proposed in part ii. to result in multicollinearity? Justify your