Answered step by step
Verified Expert Solution
Question
1 Approved Answer
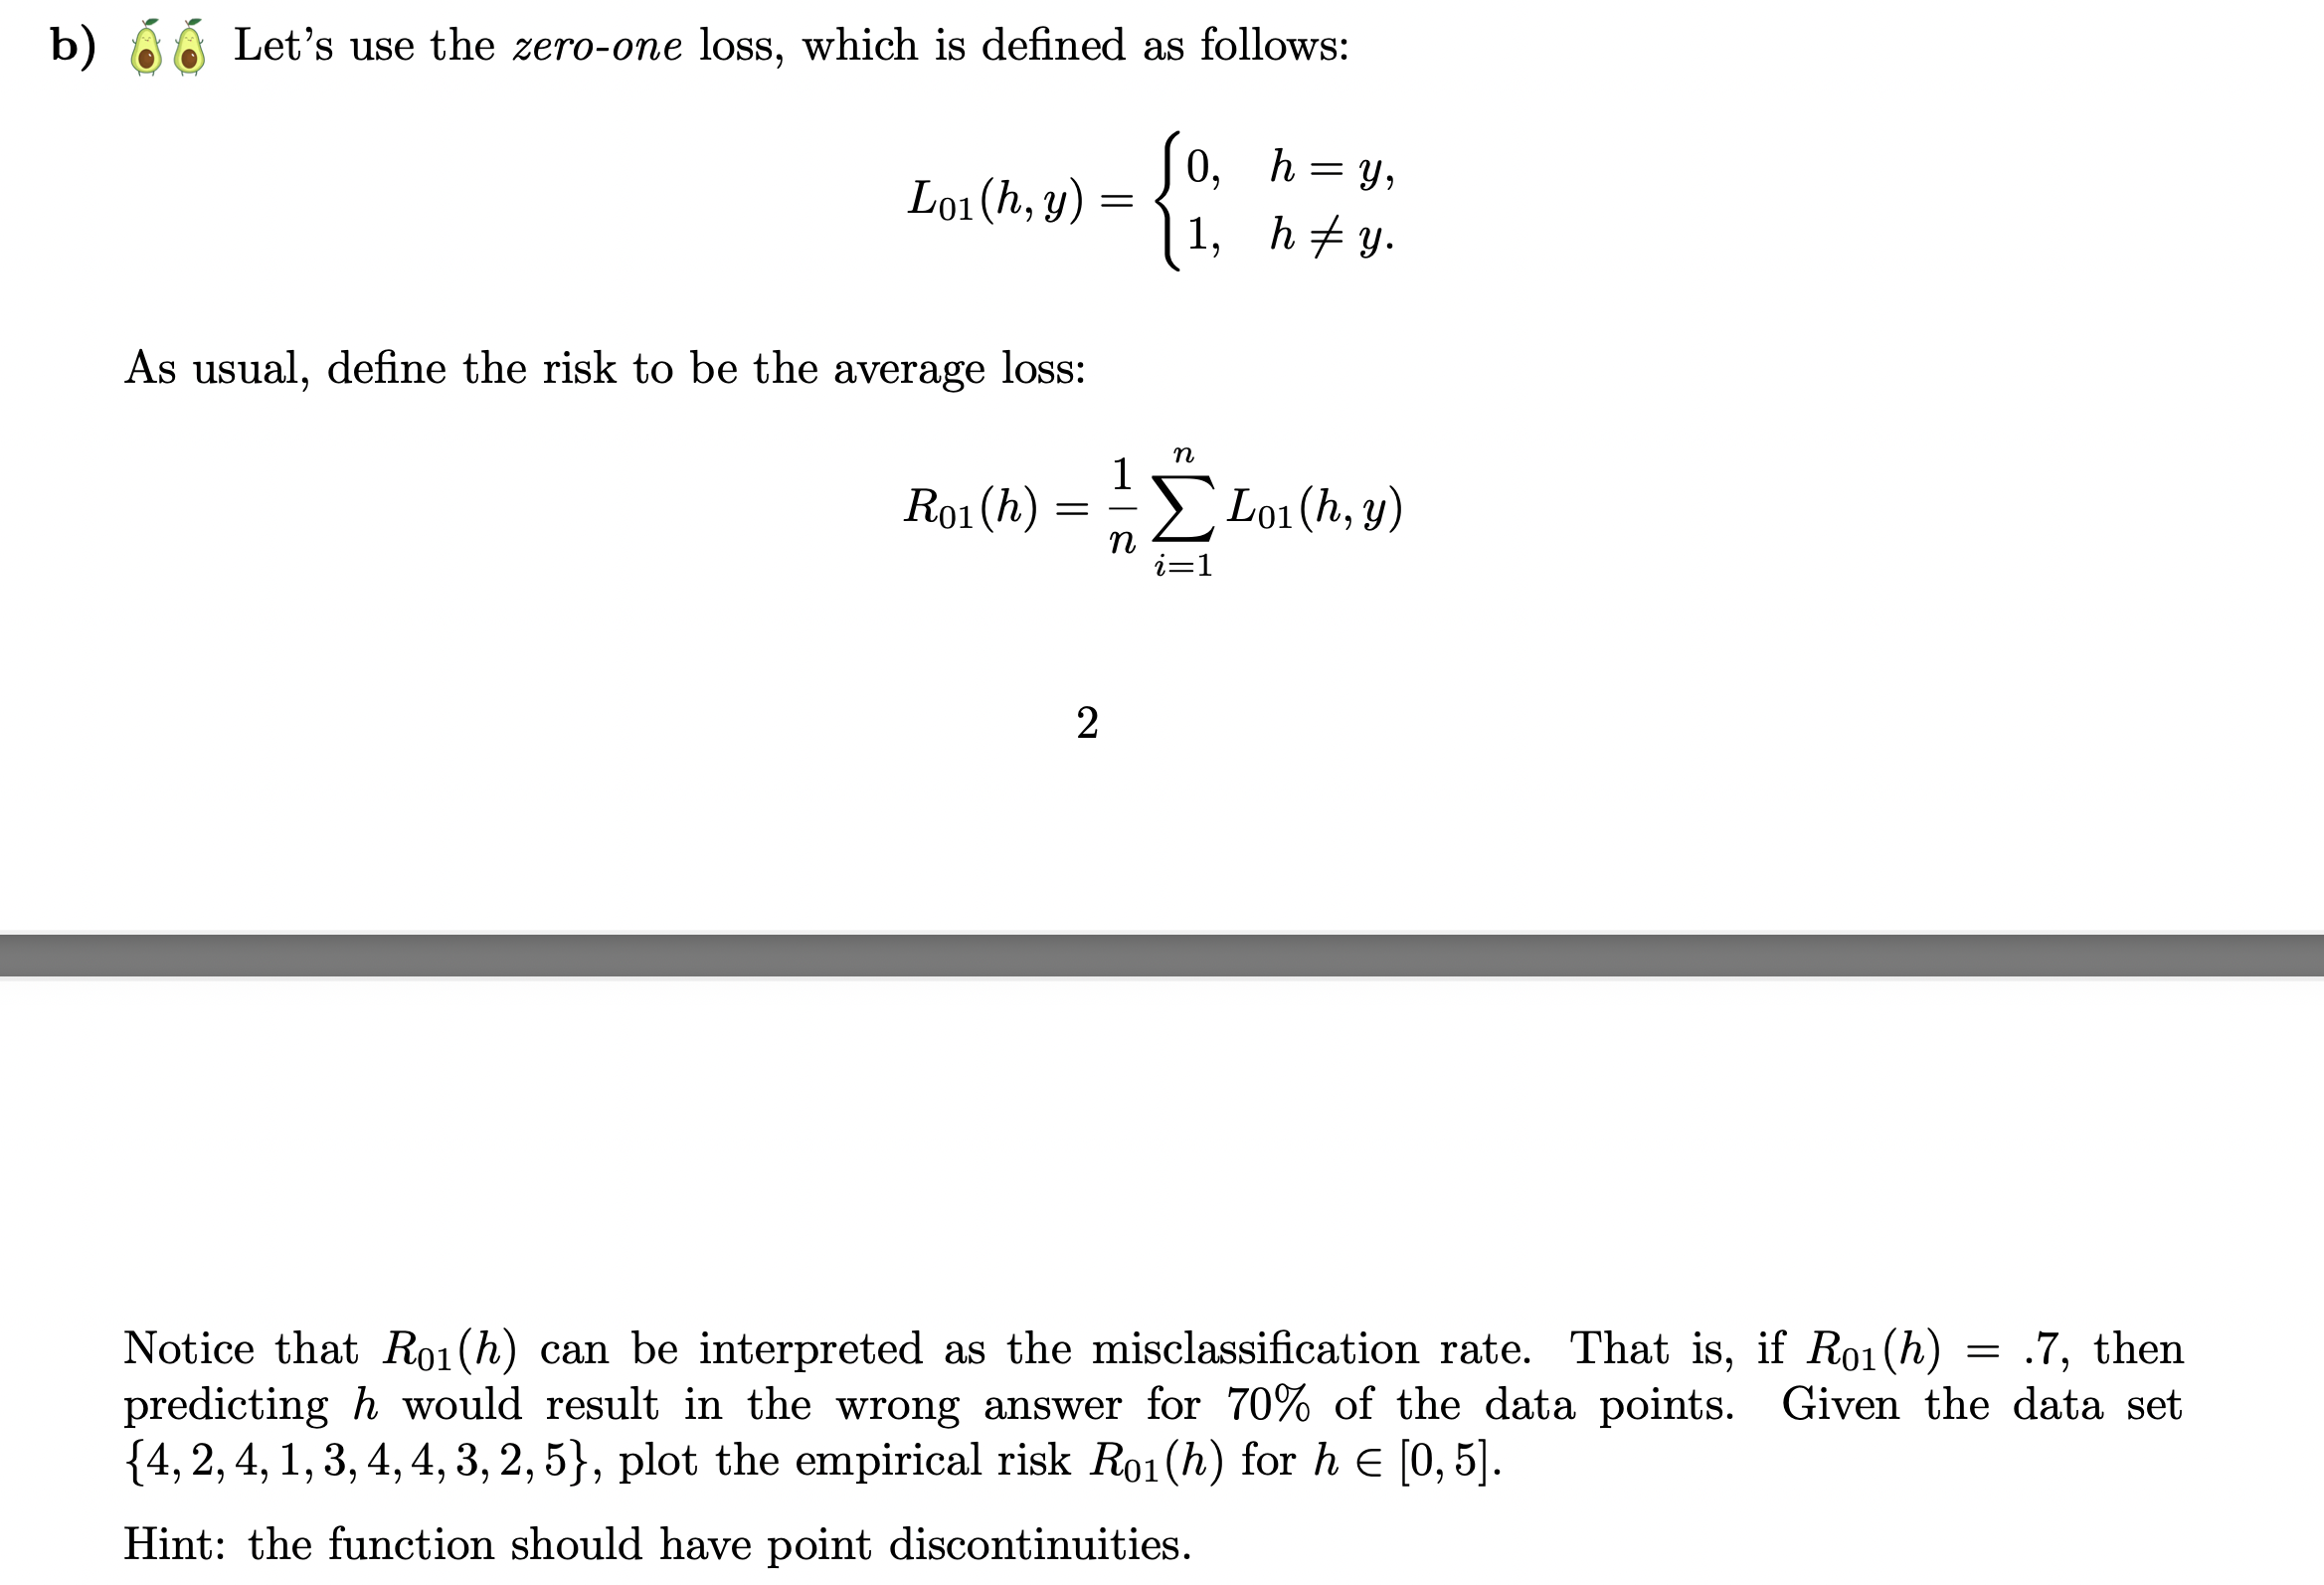
b) Let's use the zero-one loss, which is defined as follows: Lo1(h, y) = { 0, h = y, 1, h = y. As


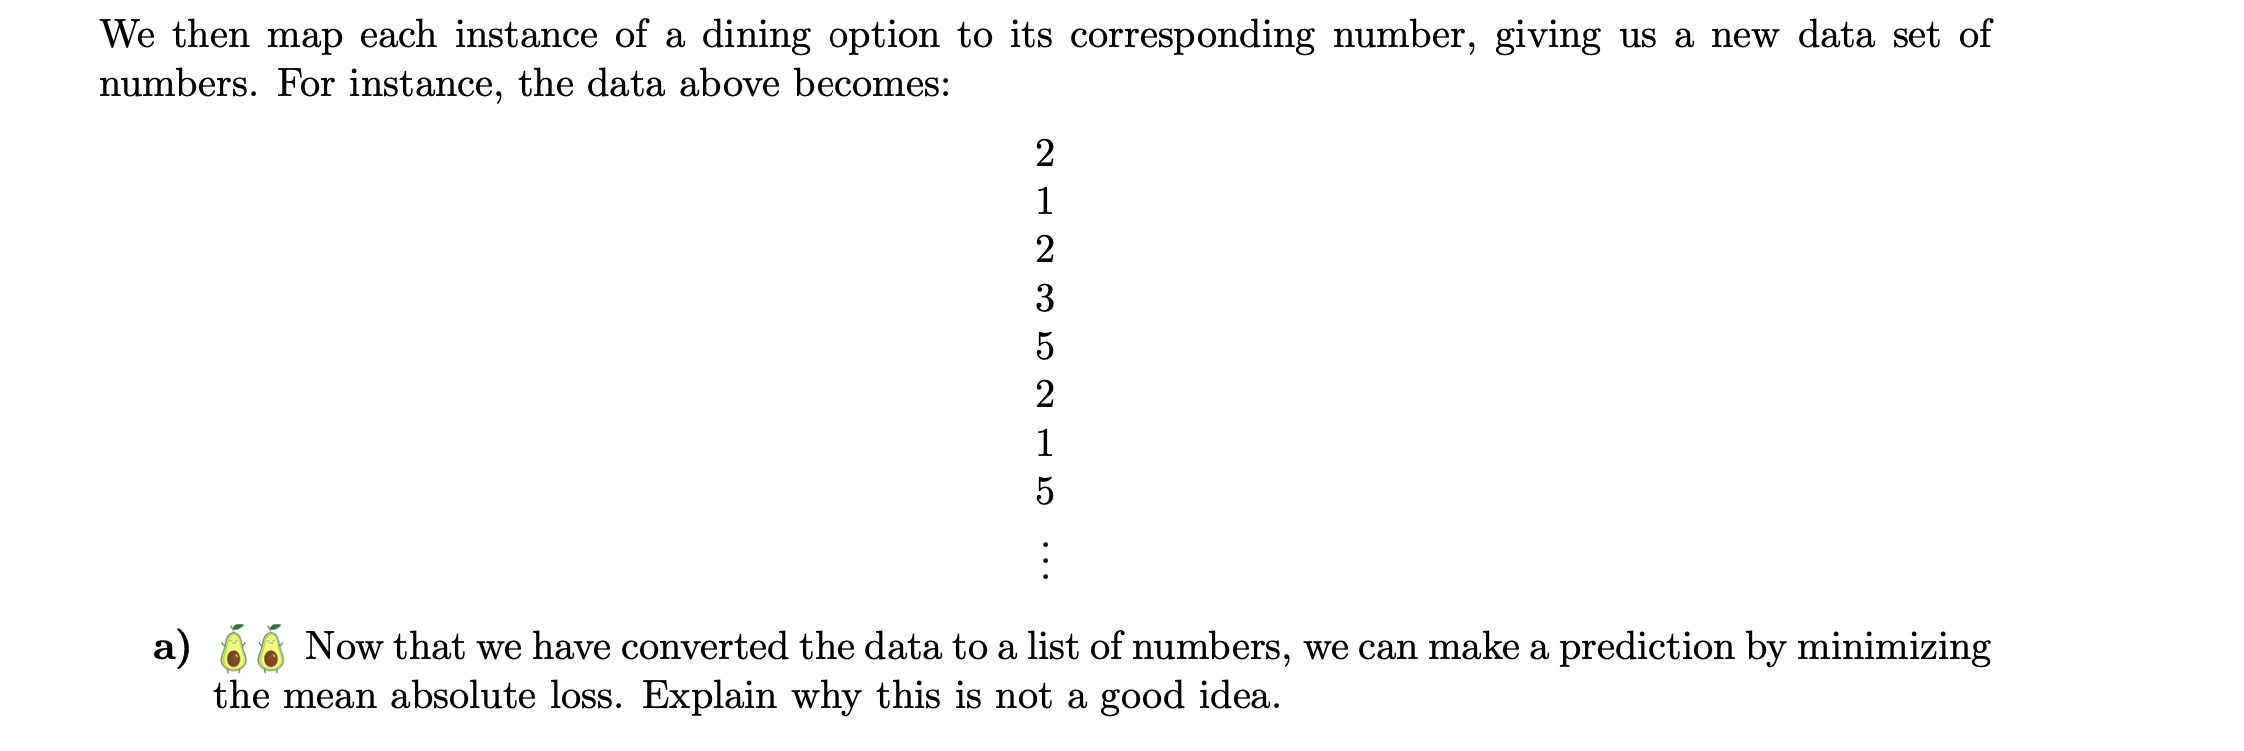
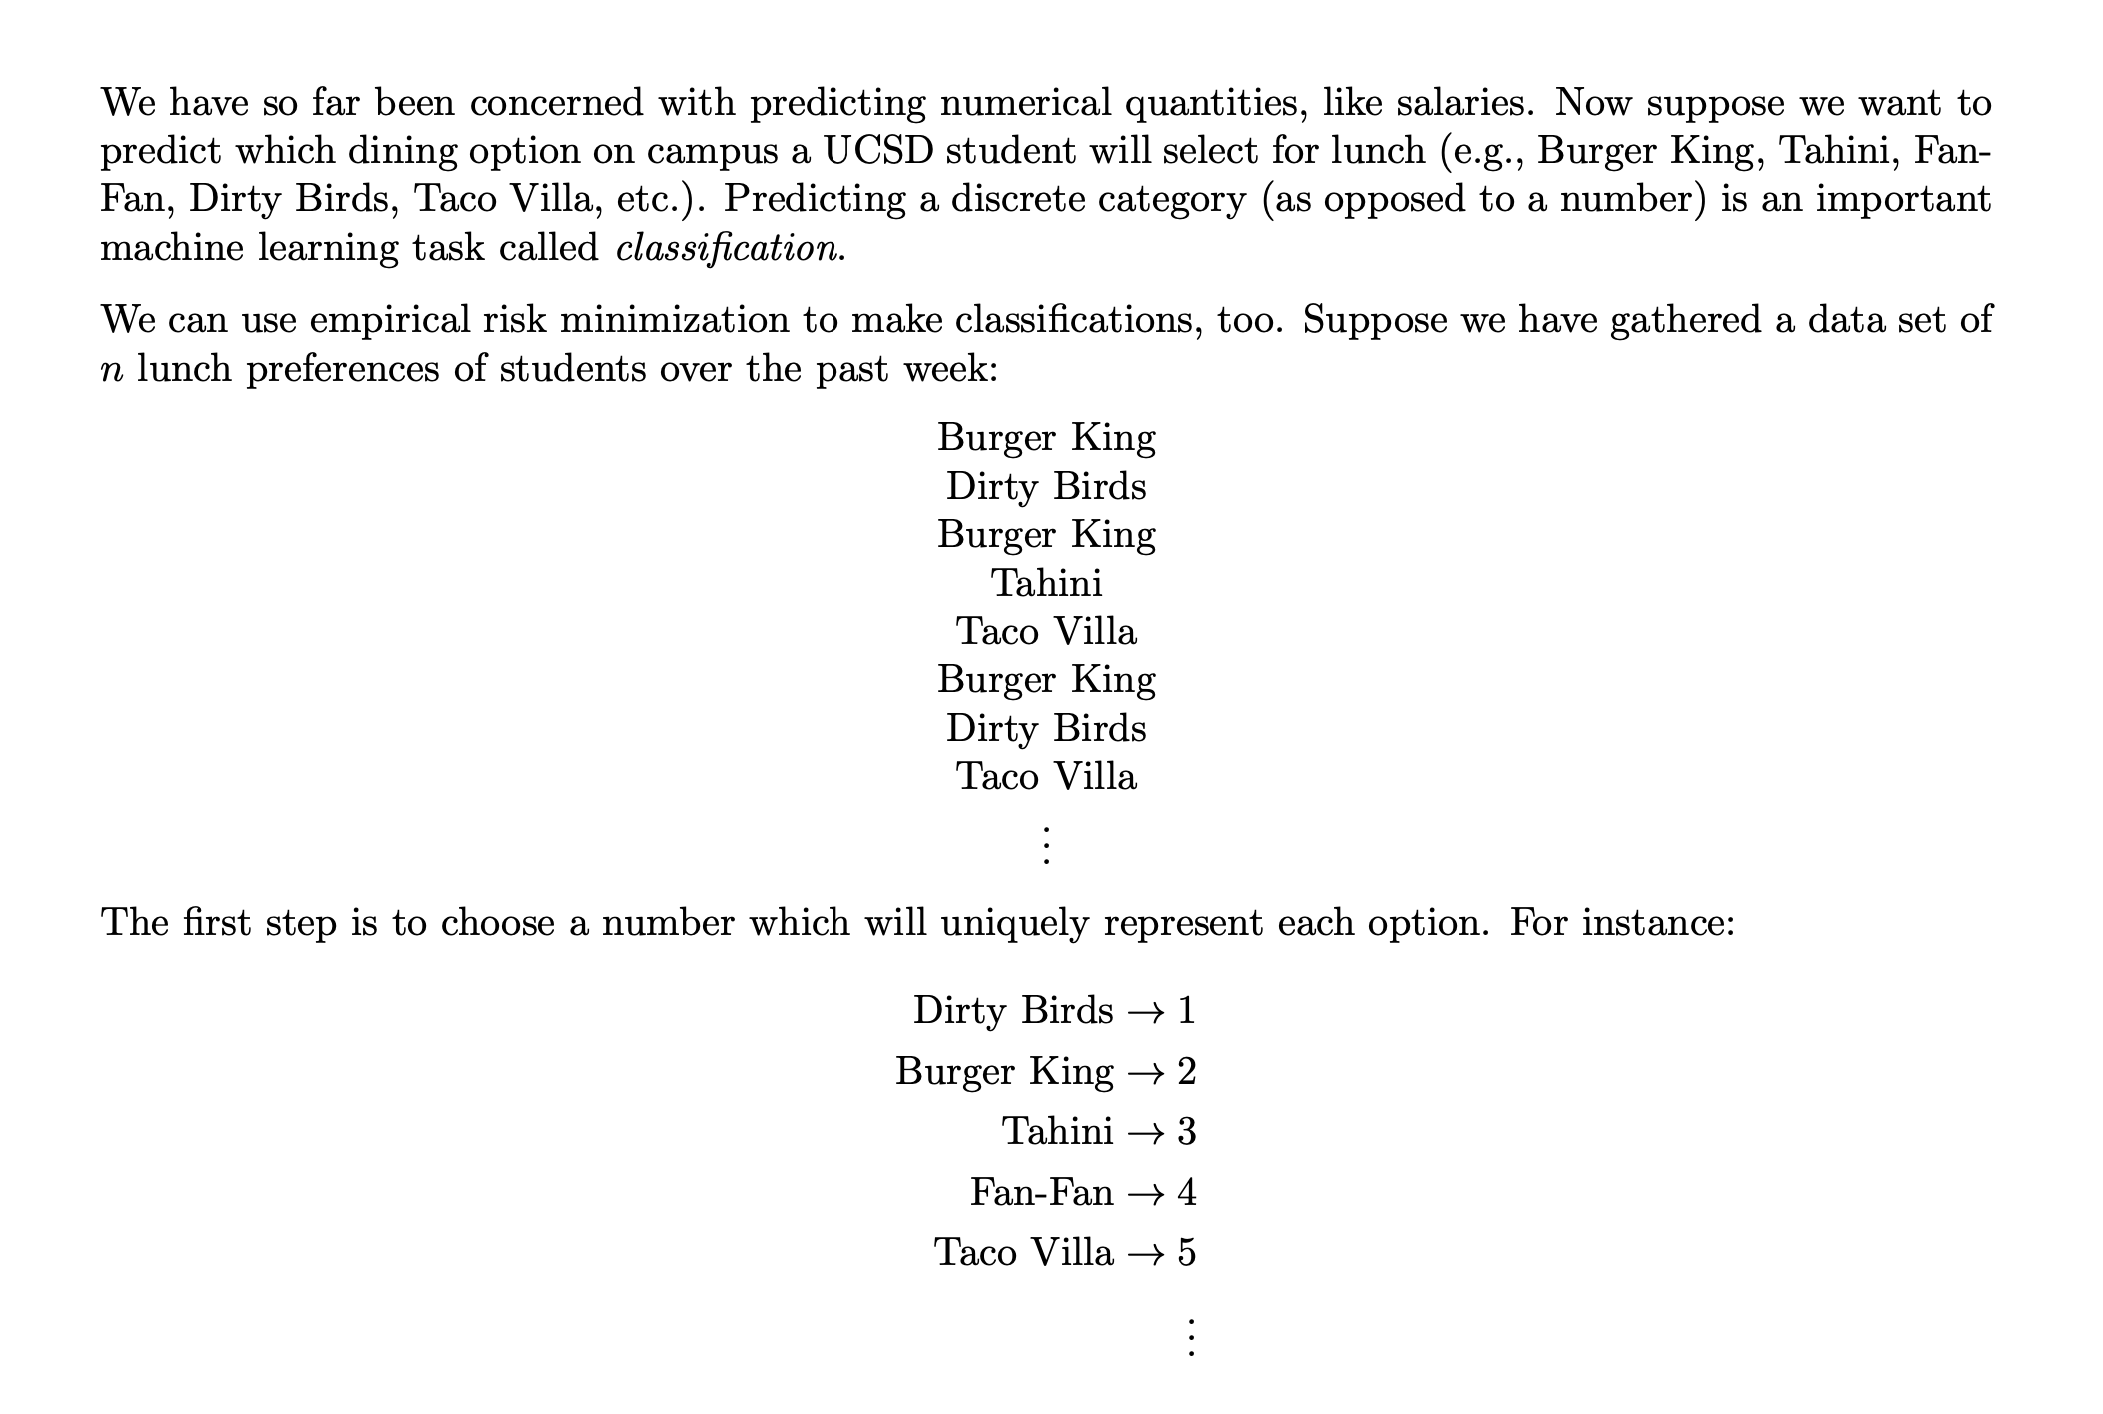
b) Let's use the zero-one loss, which is defined as follows: Lo1(h, y) = { 0, h = y, 1, h = y. As usual, define the risk to be the average loss: n 1 R01 (h) = Loi (h, y) n i=1 2 = .7, then Notice that Ro(h) can be interpreted as the misclassification rate. That is, if R01 (h) predicting h would result in the wrong answer for 70% of the data points. Given the data set {4, 2, 4, 1, 3, 4, 4, 3, 2, 5}, plot the empirical risk Ro1(h) for h [0,5]. Hint: the function should have point discontinuities. We then map each instance of a dining option to its corresponding number, giving us a new data set of numbers. For instance, the data above becomes: 21235215 : a) Now that we have converted the data to a list of numbers, we can make a prediction by minimizing the mean absolute loss. Explain why this is not a good idea. We have so far been concerned with predicting numerical quantities, like salaries. Now suppose we want to predict which dining option on campus a UCSD student will select for lunch (e.g., Burger King, Tahini, Fan- Fan, Dirty Birds, Taco Villa, etc.). Predicting a discrete category (as opposed to a number) is an important machine learning task called classification. We can use empirical risk minimization to make classifications, too. Suppose we have gathered a data set of n lunch preferences of students over the past week: Burger King Dirty Birds Burger King Tahini Taco Villa Burger King Dirty Birds Taco Villa : The first step is to choose a number which will uniquely represent each option. For instance: Dirty Birds 1 Burger King 2 Tahini 3 Fan-Fan 4 Taco Villa 5
Step by Step Solution
There are 3 Steps involved in it
Step: 1

Get Instant Access to Expert-Tailored Solutions
See step-by-step solutions with expert insights and AI powered tools for academic success
Step: 2

Step: 3

Ace Your Homework with AI
Get the answers you need in no time with our AI-driven, step-by-step assistance
Get Started


