Answered step by step
Verified Expert Solution
Question
1 Approved Answer
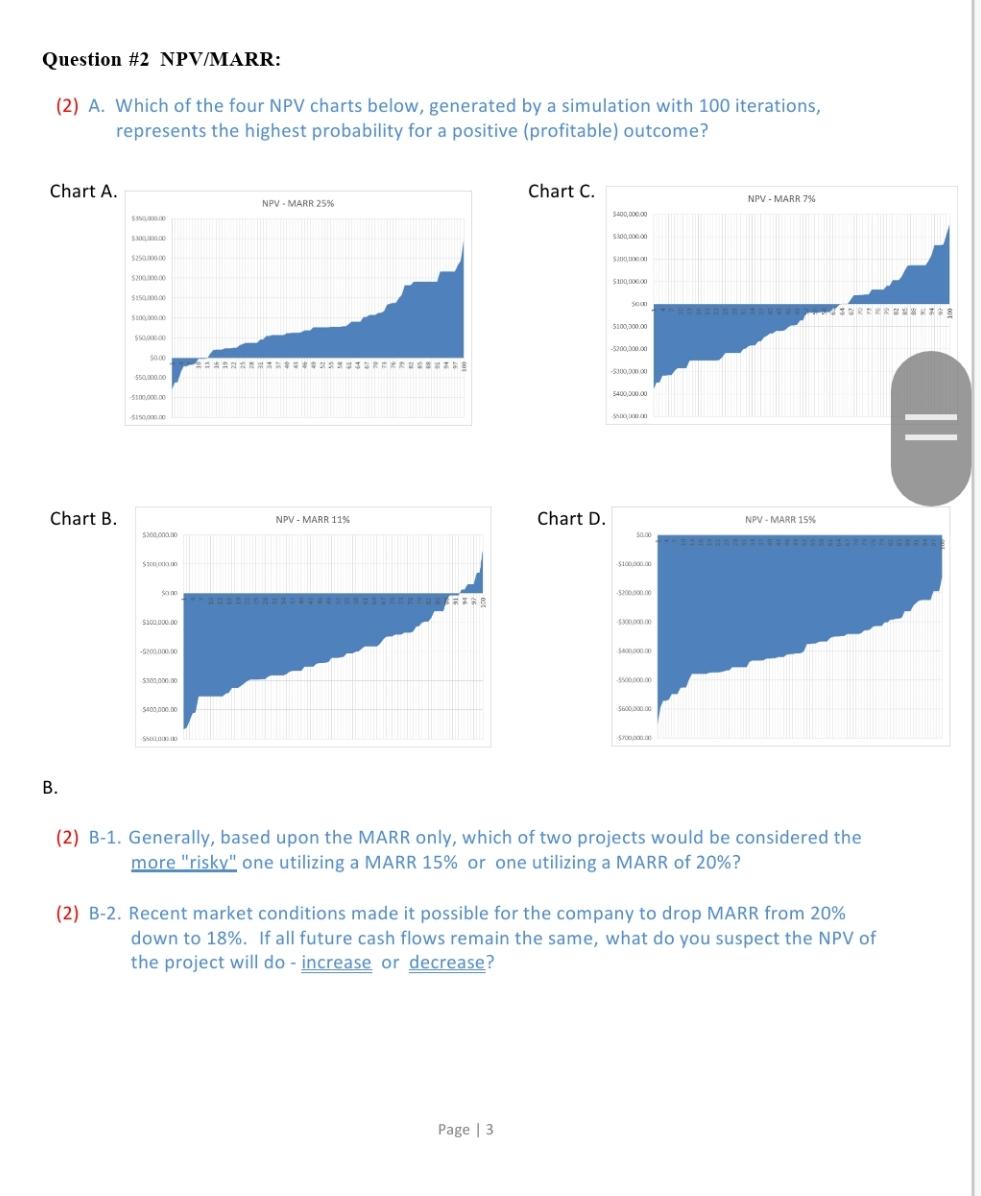
B. Question #2 NPV/MARR: (2) A. Which of the four NPV charts below, generated by a simulation with 100 iterations, represents the highest probability

B. Question #2 NPV/MARR: (2) A. Which of the four NPV charts below, generated by a simulation with 100 iterations, represents the highest probability for a positive (profitable) outcome? Chart A. NPV-MARR 25% $300.00 $250,000.00 $2000000 $15000.00 $400,000.00 $50,000.00 50.00 $50,000.00 $100,000.00 $150,000.00 Chart C. NPV - MARR 7% $400,000.00 $300,000.00 $200,000 $100,000.00 5000 $100,000.00 -$200,000.00 -$300,00000 $400,000.00 Chart B. NPV-MARR 11% Chart D. NPV-MARR 15% $300.000.00 $0.00 $300,000.00 $300,000.00 -$200.000.00 $300,000.00 $400,000.00 $500.00 $100,000.00 $200,000.00 $300,000.00 $400,000.00 $500,000.001 $600,000.00 $700,000.00 (2) B-1. Generally, based upon the MARR only, which of two projects would be considered the more "risky" one utilizing a MARR 15% or one utilizing a MARR of 20%? (2) B-2. Recent market conditions made it possible for the company to drop MARR from 20% down to 18%. If all future cash flows remain the same, what do you suspect the NPV of the project will do - increase or decrease? Page 3 ||
Step by Step Solution
There are 3 Steps involved in it
Step: 1

Get Instant Access to Expert-Tailored Solutions
See step-by-step solutions with expert insights and AI powered tools for academic success
Step: 2

Step: 3

Ace Your Homework with AI
Get the answers you need in no time with our AI-driven, step-by-step assistance
Get Started


