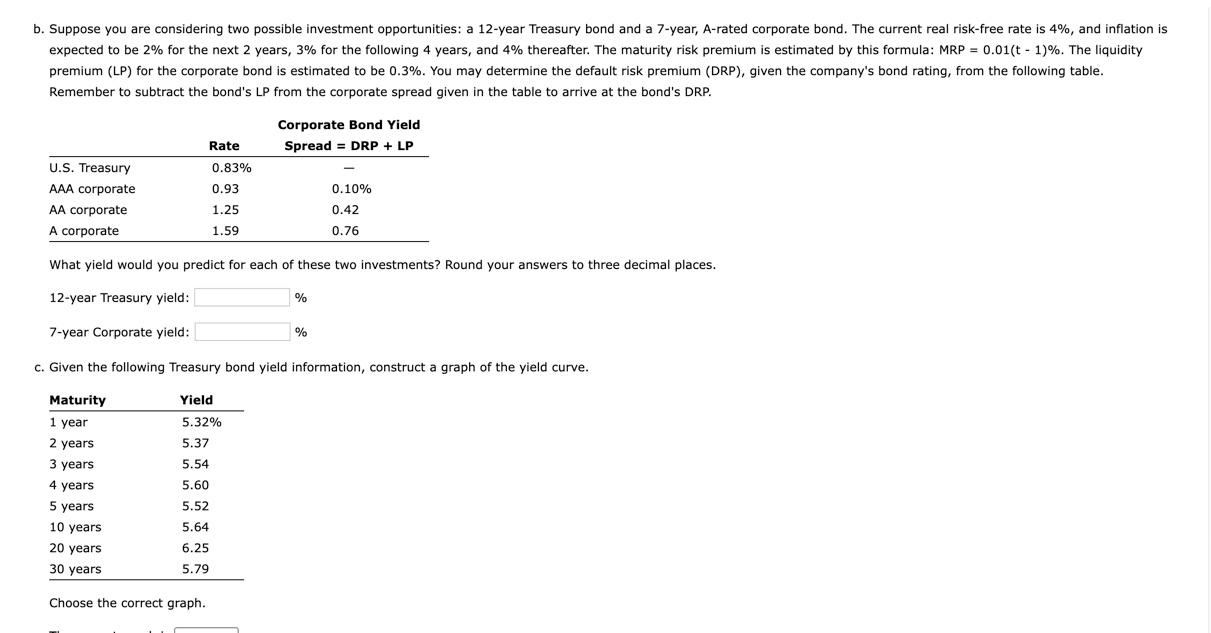
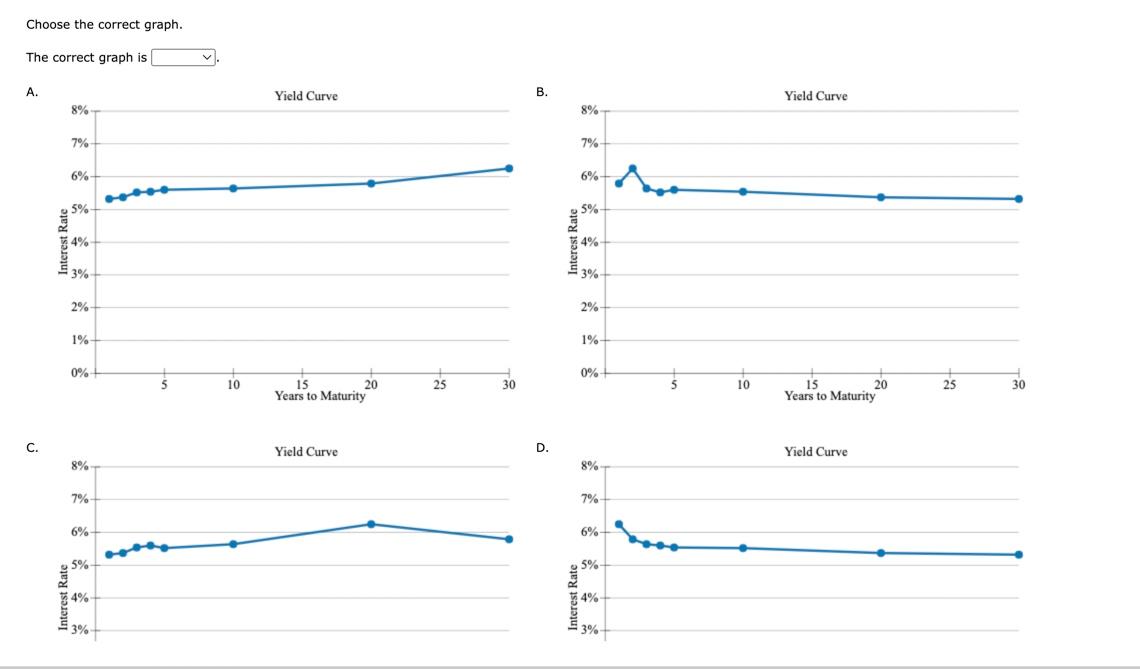
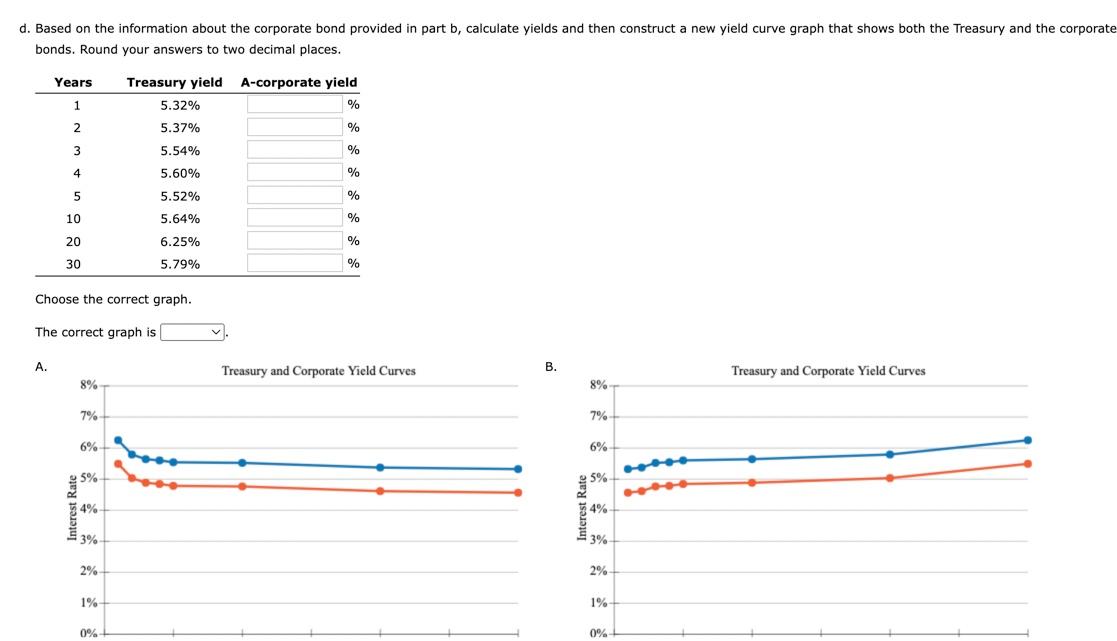
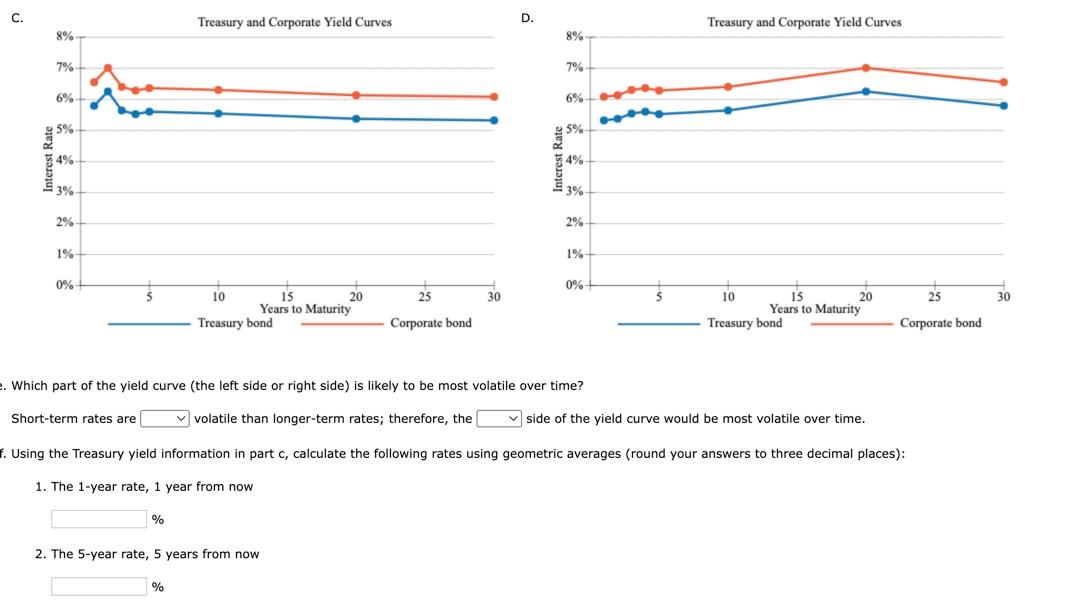
b. Suppose you are considering two possible investment opportunities: a 12-year Treasury bond and a 7-year, A-rated corporate bond. The current real risk-free rate is 4%, and inflation is expected to be 2% for the next 2 years, 3% for the following 4 years, and 4% thereafter. The maturity risk premium is estimated by this formula: MRP = 0.01(t-1)%. The liquidity premium (LP) for the corporate bond is estimated to be 0.3%. You may determine the default risk premium (DRP), given the company's bond rating, from the following table. Remember to subtract the bond's LP from the corporate spread given in the table to arrive at the bond's DRP. Corporate Bond Yield Spread = DRP + LP Rate 0.83% 0.93 0.10% U.S. Treasury AAA corporate AA corporate A corporate 1.25 0.42 0.76 1.59 What yield would you predict for each of these two investments? Round your answers to three decimal places. 12-year Treasury yield: % 7-year Corporate yield: % c. Given the following Treasury bond yield information, construct a graph of the yield curve. Yield 5.32% 5.37 5.54 Maturity 1 year 2 years 3 years 4 years 5 years 10 years 20 years 30 years 5.60 5.52 5.64 6.25 5.79 Choose the correct graph. Choose the correct graph. The correct graph is A. Yield Curve B. Yield Curve 8% 8% 7% 7% 6% 6% 5% 25% 4% 4% $ 3% 33% 2% 2% 1% 1% 0% 0% 10 15 20 Years to Maturity 25 30 10 15 20 Years to Maturity 25 30 C. Yield Curve D. Yield Curve 8% 8% 7% 7% 6% 6% 5% 5% 4% 3% 3% d. Based on the information about the corporate bond provided in part b, calculate yields and then construct a new yield curve graph that shows both the Treasury and the corporate bonds. Round your answers to two decimal places. Years Treasury yield A-corporate yield 5.32% % 1 2 % 5.37% 5.54% 3 % % 4 5.60% % 5 5.52% % 10 5.64% % 20 6.25% % 30 5.79% % Choose the correct graph. The correct graph is A. Treasury and Corporate Yield Curves B. Treasury and Corporate Yield Curves 8% 8% 7% 7% 7 6% 6% 5% 5 25 5% 4% nterest Rate 34% 3% 3% 2% 2% 1% 1% 0% 0% C. Treasury and Corporate Yield Curves D. Treasury and Corporate Yield Curves 8% 8% 7% 7% 6% 6% 5% Interest Rate 4% 74% 5 53% 53% 2% 2% 1% 1% 0% 0% 25 30 25 30 10 20 Years to Maturity Treasury bond 10 15 Years to Maturity Treasury bond Corporate bond Corporate bond Which part of the yield curve (the left side or right side) is likely to be most volatile over time? Short-term rates are volatile than longer-term rates; therefore, the side of the yield curve would be most volatile over time. f. Using the Treasury yield information in part c, calculate the following rates using geometric averages (round your answers to three decimal places): 1. The 1-year rate, 1 year from now % 2. The 5-year rate, 5 years from now % 3. The 10-year rate, 10 years from now % 4. The 10-year rate, 20 years from now %