Answered step by step
Verified Expert Solution
Question
1 Approved Answer
b) Table 1 is taken from Gu, Pan and Wang (2018), Chinese Capital Market: An Empirical Overview, NBER Working Paper 24346. It describes the value
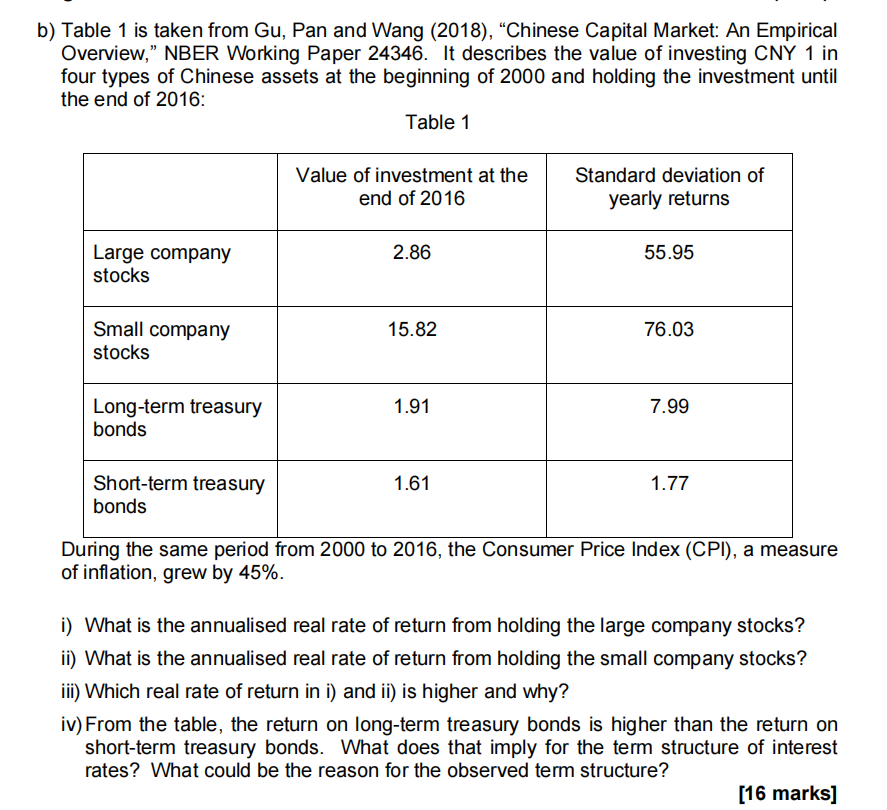
b) Table 1 is taken from Gu, Pan and Wang (2018), Chinese Capital Market: An Empirical Overview, NBER Working Paper 24346. It describes the value of investing CNY 1 in four types of Chinese assets at the beginning of 2000 and holding the investment until the end of 2016: Table 1 Value of investment at the end of 2016 Standard deviation of yearly returns 2.86 55.95 Large company stocks 15.82 76.03 Small company stocks 1.91 7.99 Long-term treasury bonds 1.61 1.77 Short-term treasury bonds During the same period from 2000 to 2016, the Consumer Price Index (CPI), a measure of inflation, grew by 45%. i) What is the annualised real rate of return from holding the large company stocks? ii) What is the annualised real rate of return from holding the small company stocks? iii) Which real rate of return in i) and ii) is higher and why? iv) From the table, the return on long-term treasury bonds is higher than the return on short-term treasury bonds. What does that imply for the term structure of interest rates? What could be the reason for the observed term structure? [16 marks]
Step by Step Solution
There are 3 Steps involved in it
Step: 1
Get Instant Access to Expert-Tailored Solutions
See step-by-step solutions with expert insights and AI powered tools for academic success
Step: 2
Step: 3
Ace Your Homework with AI
Get the answers you need in no time with our AI-driven, step-by-step assistance
Get Started