Answered step by step
Verified Expert Solution
Question
1 Approved Answer
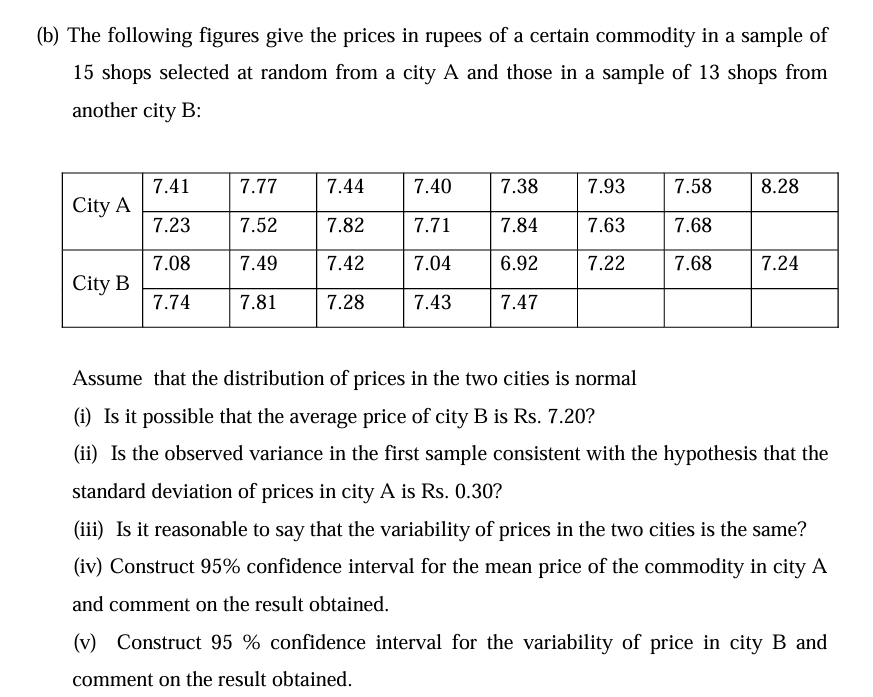
(b) The following figures give the prices in rupees of a certain commodity in a sample of 15 shops selected at random from a

(b) The following figures give the prices in rupees of a certain commodity in a sample of 15 shops selected at random from a city A and those in a sample of 13 shops from another city B: City A City B 7.41 7.23 7.08 7.74 7.77 7.52 7.49 7.81 7.44 7.82 7.42 7.28 7.40 7.71 7.04 7.43 7.38 7.84 6.92 7.47 7.93 7.63 7.22 7.58 7.68 7.68 8.28 7.24 Assume that the distribution of prices in the two cities is normal (i) Is it possible that the average price of city B is Rs. 7.20? (ii) Is the observed variance in the first sample consistent with the hypothesis that the standard deviation of prices in city A is Rs. 0.30? (iii) Is it reasonable to say that the variability of prices in the two cities is the same? (iv) Construct 95% confidence interval for the mean price of the commodity in city A and comment on the result obtained. (v) Construct 95% confidence interval for the variability of price in city B and comment on the result obtained.
Step by Step Solution
There are 3 Steps involved in it
Step: 1

Get Instant Access to Expert-Tailored Solutions
See step-by-step solutions with expert insights and AI powered tools for academic success
Step: 2

Step: 3

Ace Your Homework with AI
Get the answers you need in no time with our AI-driven, step-by-step assistance
Get Started


