

Answered step by step
Verified Expert Solution
Question
1 Approved Answer
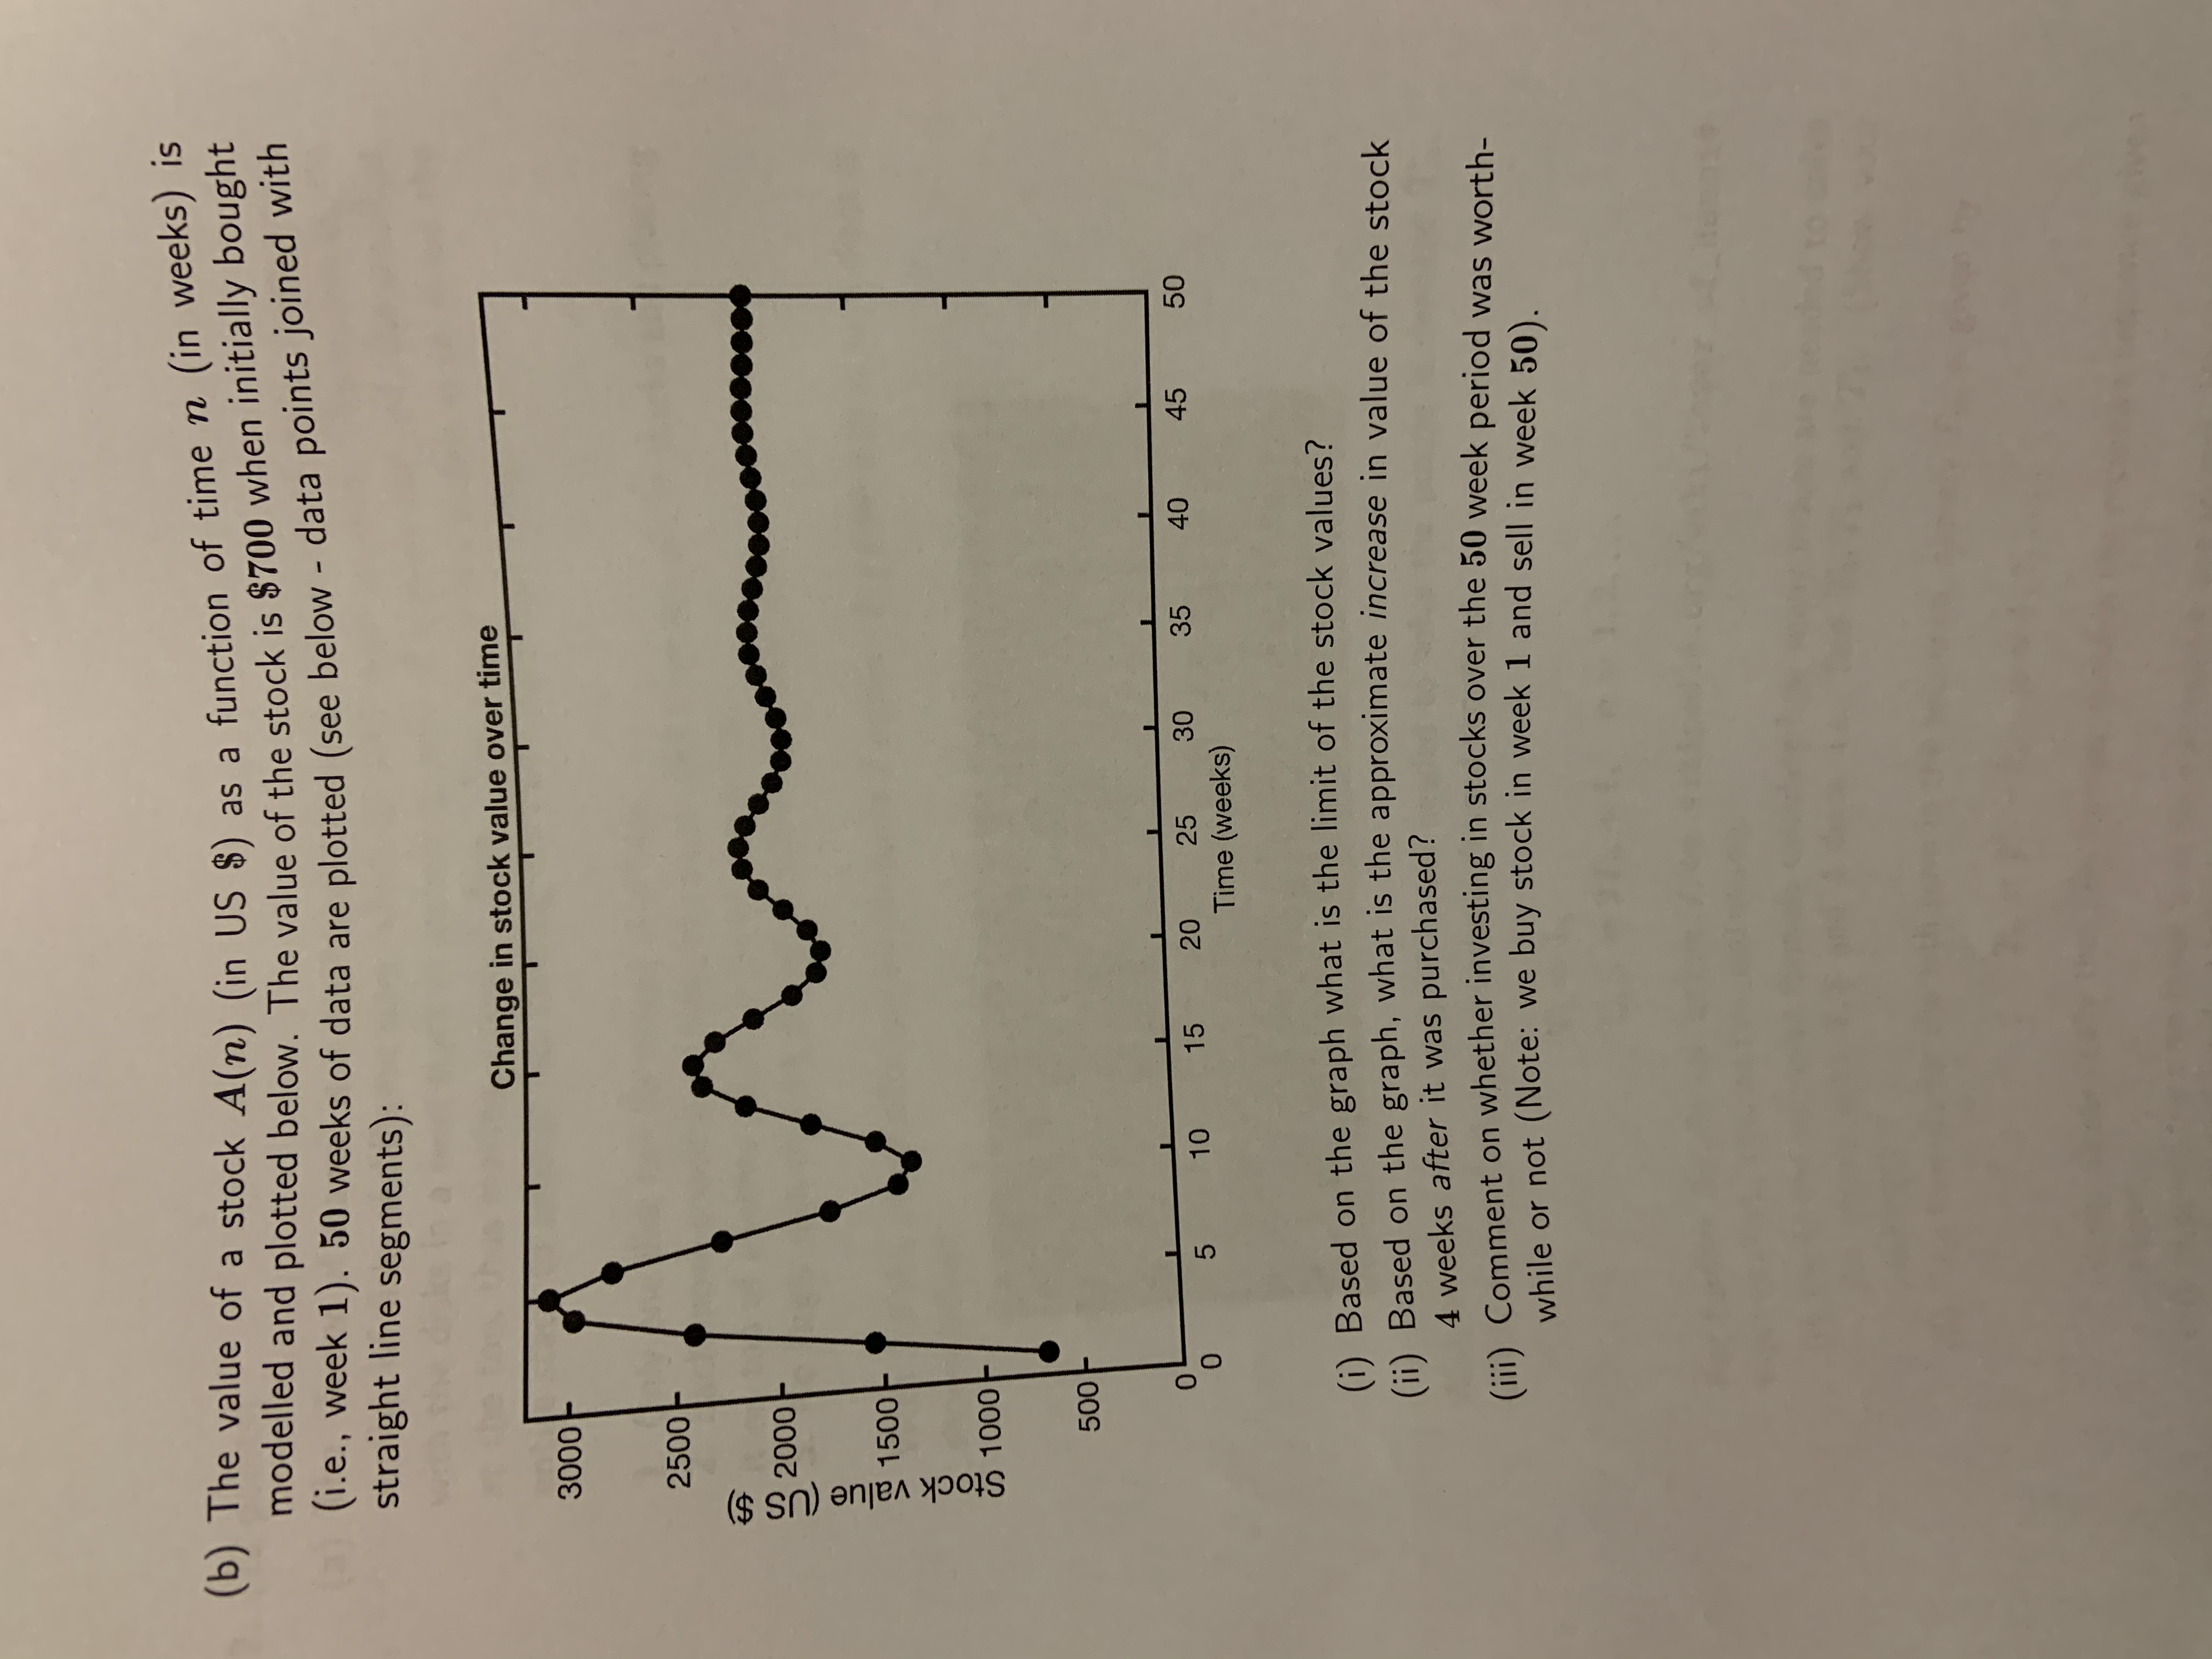
(b) The value of a stock A(n) (in US $) as a function of time n (in weeks) is modelled and plotted below. The value
Step by Step Solution
There are 3 Steps involved in it
Step: 1

Get Instant Access to Expert-Tailored Solutions
See step-by-step solutions with expert insights and AI powered tools for academic success
Step: 2

Step: 3
Ace Your Homework with AI
Get the answers you need in no time with our AI-driven, step-by-step assistance
Get Started
Introduction to Probability
Authors: Mark Daniel Ward, Ellen Gundlach
1st edition
716771098, 978-1319060893, 1319060897, 978-0716771098