

Answered step by step
Verified Expert Solution
Question
1 Approved Answer
( b ) Three thousand observations were simulated from a complicated generalised inverse Gaussian distribution. The data are shown in the histograms on the next
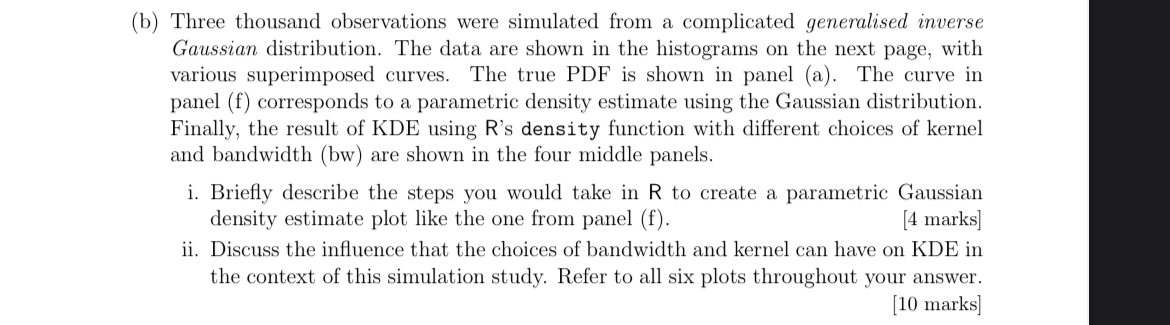
b Three thousand observations were simulated from a complicated generalised inverse Gaussian distribution. The data are shown in the histograms on the next page, with various superimposed curves. The true PDF is shown in panel a The curve in panel f corresponds to a parametric density estimate using the Gaussian distribution. Finally, the result of KDE using Rs density function with different choices of kernel and bandwidth bw are shown in the four middle panels.
i Briefly describe the steps you would take in R to create a parametric Gaussian density estimate plot like the one from panel f
marks
ii Discuss the influence that the choices of bandwidth and kernel can have on KDE in the context of this simulation study. Solve by hand Refer to all six plots throughout your answer.
marks
Step by Step Solution
There are 3 Steps involved in it
Step: 1

Get Instant Access to Expert-Tailored Solutions
See step-by-step solutions with expert insights and AI powered tools for academic success
Step: 2

Step: 3
Ace Your Homework with AI
Get the answers you need in no time with our AI-driven, step-by-step assistance
Get Started
Oracle 10g Database Administrator Implementation And Administration
Authors: Gavin Powell, Carol McCullough Dieter
2nd Edition
1418836656, 9781418836658