

Answered step by step
Verified Expert Solution
Question
1 Approved Answer
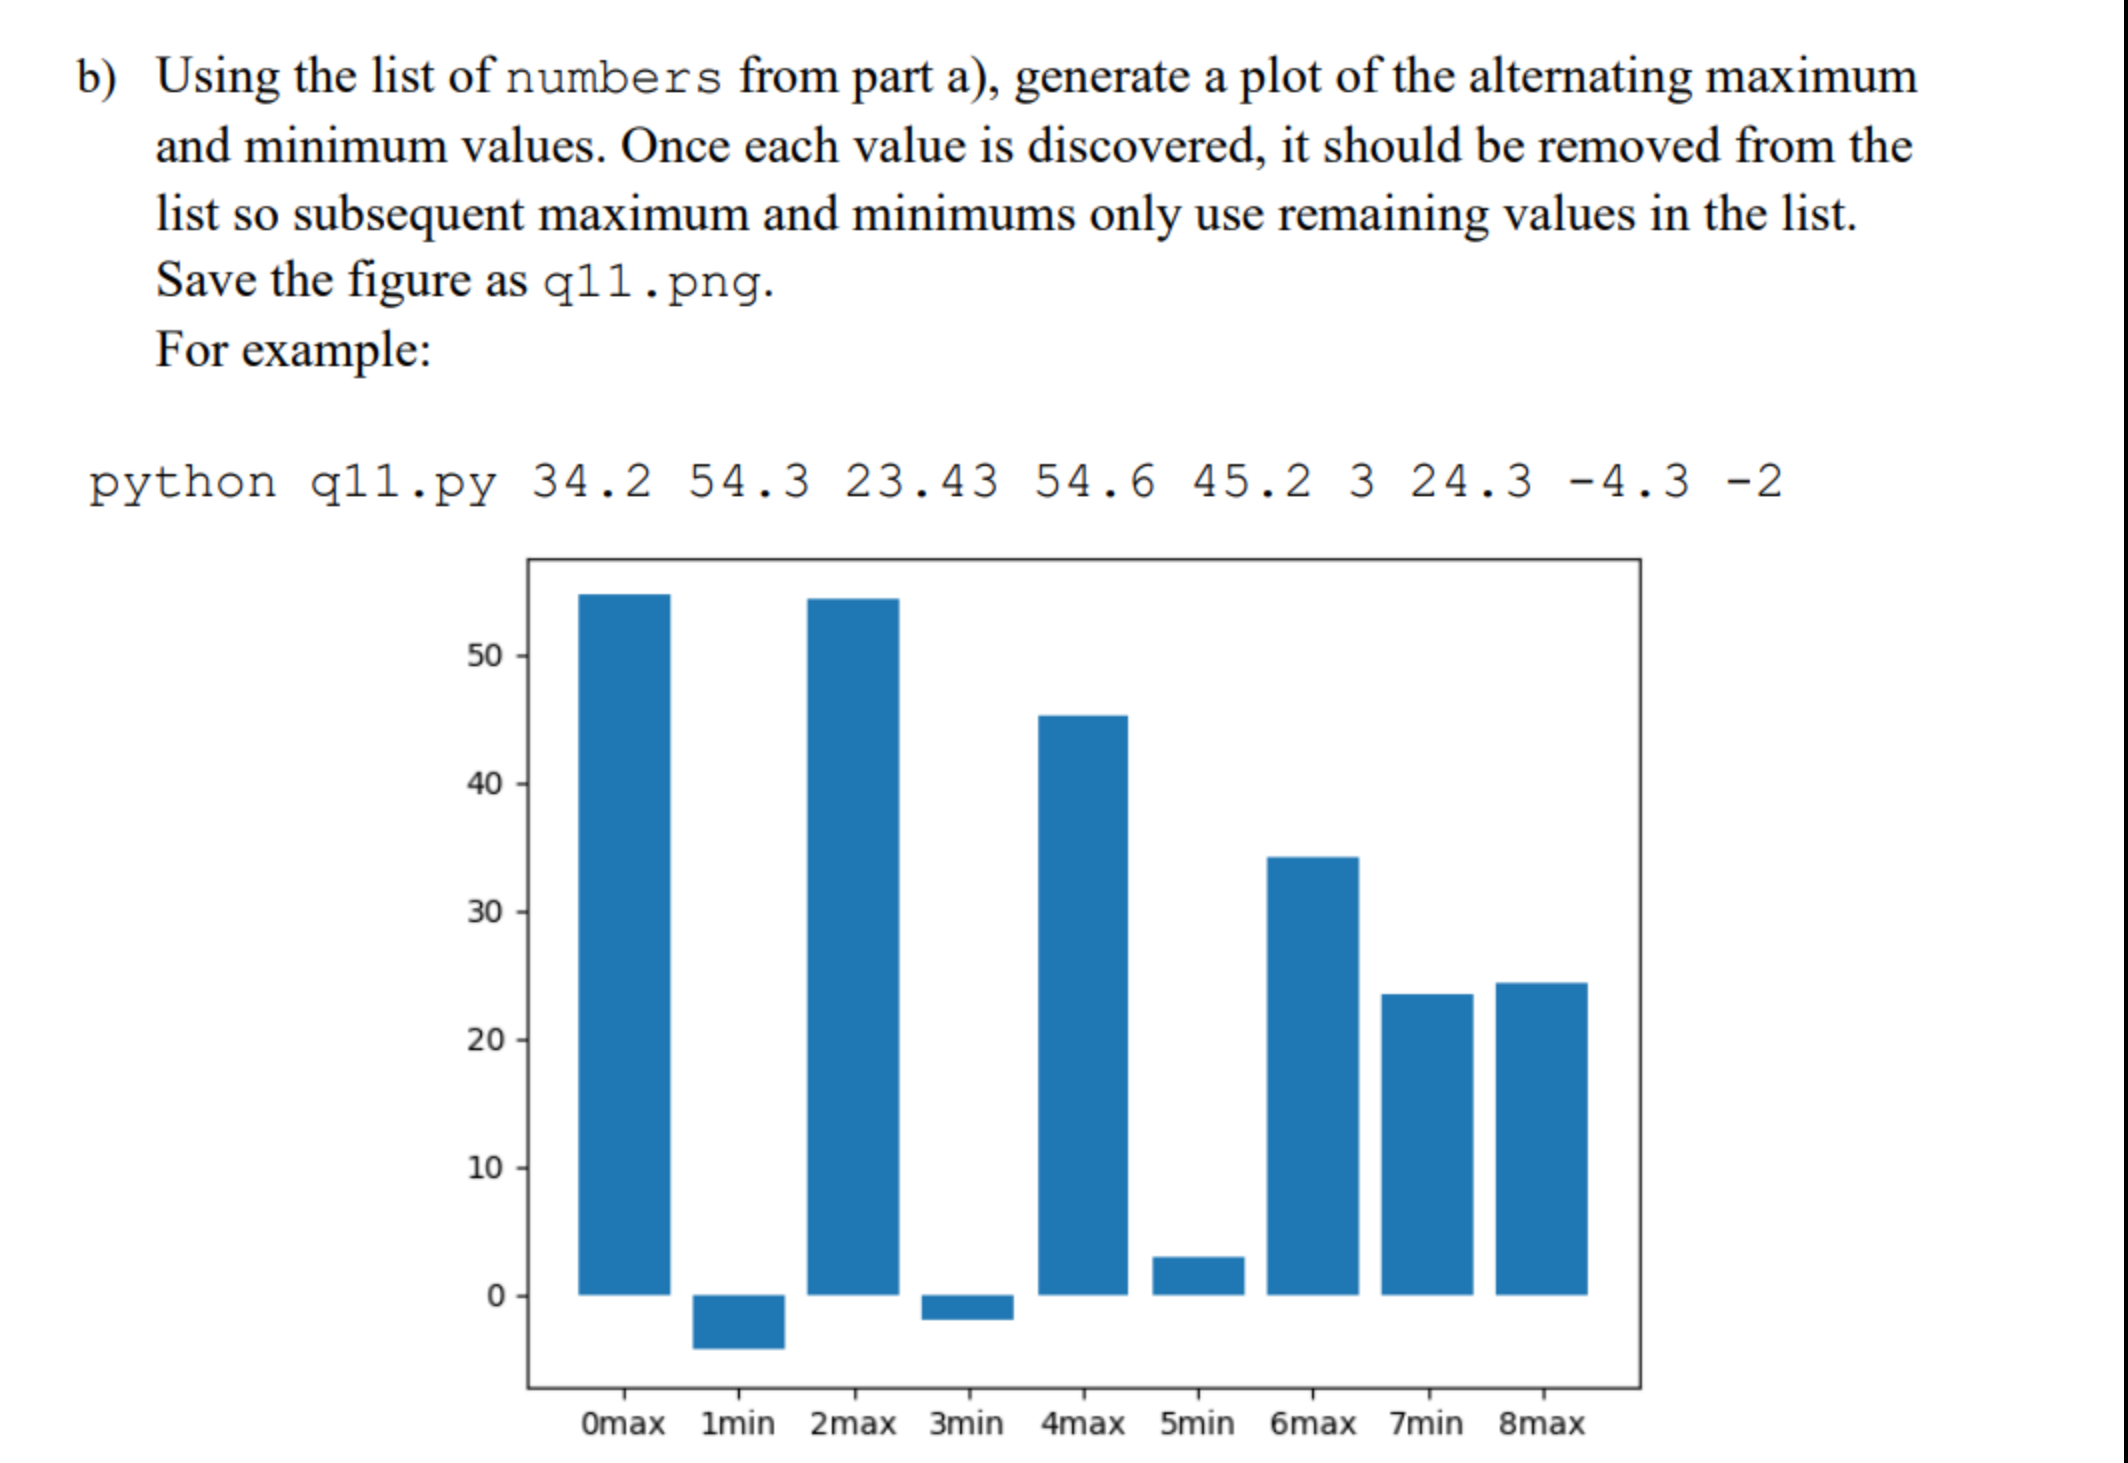
b ) Using the list of numbers from part a ) , generate a plot of the alternating maximum and minimum values. Once each value
b Using the list of numbers from part a generate a plot of the alternating maximum
and minimum values. Once each value is discovered, it should be removed from the
list so subsequent maximum and minimums only use remaining values in the list.
Save the figure as q png
For example:
python
qpy
Step by Step Solution
There are 3 Steps involved in it
Step: 1

Get Instant Access to Expert-Tailored Solutions
See step-by-step solutions with expert insights and AI powered tools for academic success
Step: 2

Step: 3
Ace Your Homework with AI
Get the answers you need in no time with our AI-driven, step-by-step assistance
Get Started
Data Science Project Ideas In Health Care Volume 1
Authors: Zemelak Goraga
1st Edition
B0CPX2RWPF, 979-8223791072