Answered step by step
Verified Expert Solution
Link Copied!

Question

1 Approved Answer

B1 Refer to the information shown in the table below. Each column in the table represents the depreciation values for a different depreciation method. Which

B1
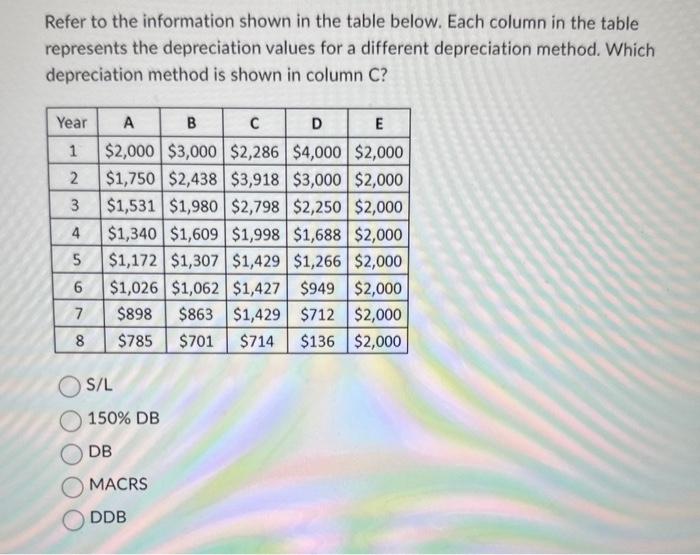
image text in transcribed
Refer to the information shown in the table below. Each column in the table represents the depreciation values for a different depreciation method. Which depreciation method is shown in column C? Year A B C D E 1 $2,000 $3,000 $2,286 $4,000 $2,000 2 $1,750 $2,438 $3,918 $3,000 $2,000 3 $1,531 $1,980 $2,798 $2,250 $2,000 4 $1,340 $1,609 $1,998 $1,688 $2,000 5 $1,172 $1,307 $1,429 $1,266 $2,000 6 $1,026 $1,062 $1,427 $949 $2,000 7 $898 $863 $1,429 $712 $2,000 8 $785 $701 $714 $136 $2,000 OS/L 150% DB DB MACRS DDB

Step by Step Solution

There are 3 Steps involved in it

Step: 1

blur-text-image

Get Instant Access to Expert-Tailored Solutions

See step-by-step solutions with expert insights and AI powered tools for academic success

Step: 2

blur-text-image

Step: 3

blur-text-image

Ace Your Homework with AI

Get the answers you need in no time with our AI-driven, step-by-step assistance

Get Started

Recommended Textbook for

Managerial Economics and Business Strategy

Authors: Michael R. baye

7th Edition

978-0073375960, 71267441, 73375969, 978-0071267441

More Books

Students also viewed these Economics questions

Question

What motivational theory applies best to this scenario? Explain.

Answered: 1 week ago

Question

Do you think Shameka acted appropriately? Why or why not?

Answered: 1 week ago