Answered step by step
Verified Expert Solution
Question
1 Approved Answer
Background Information: The local brewery Surly launched a new product, a pale largely targeted towards the residents of the Twin Cities. To promote the new
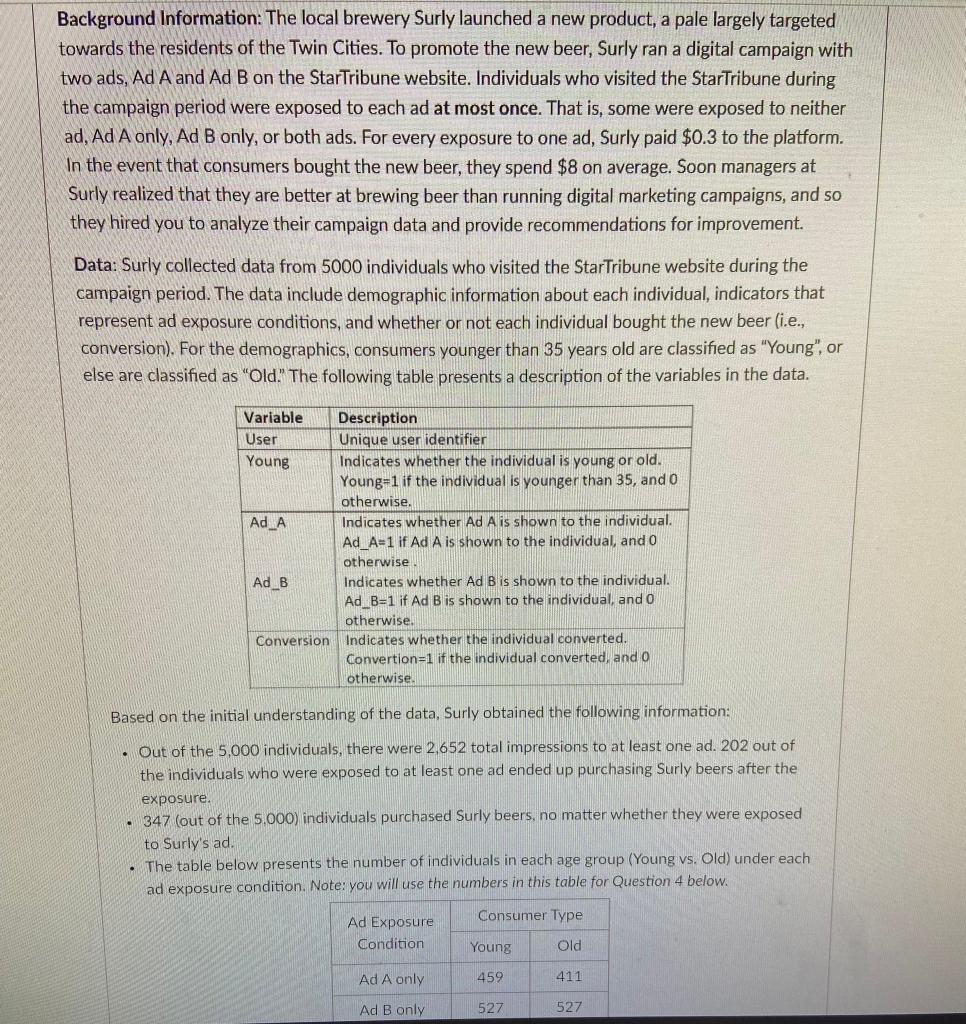
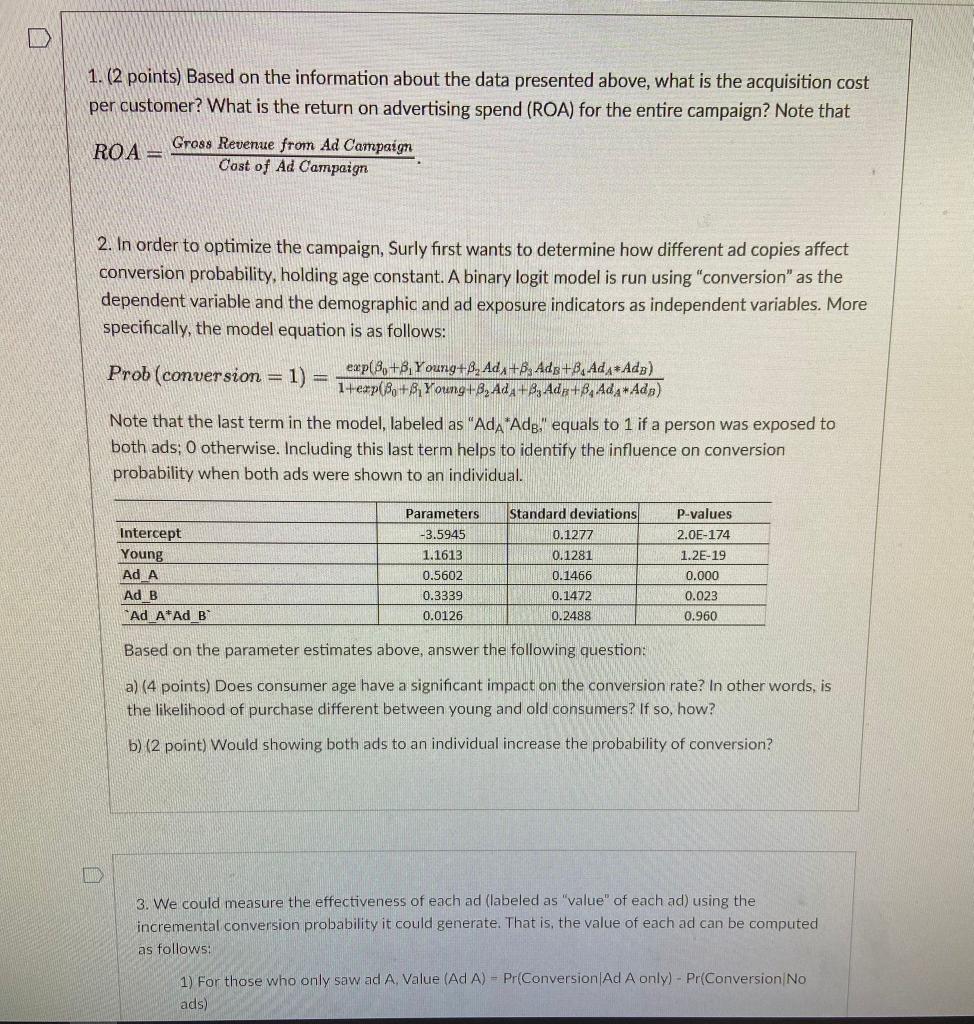
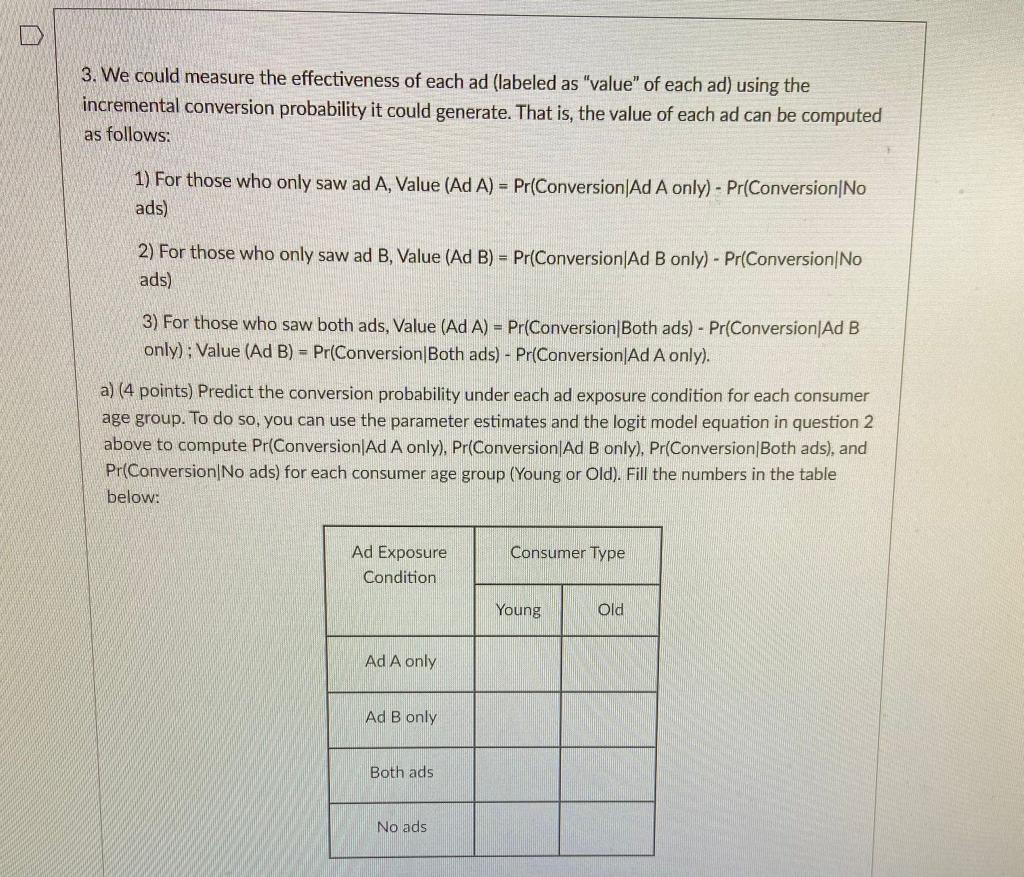
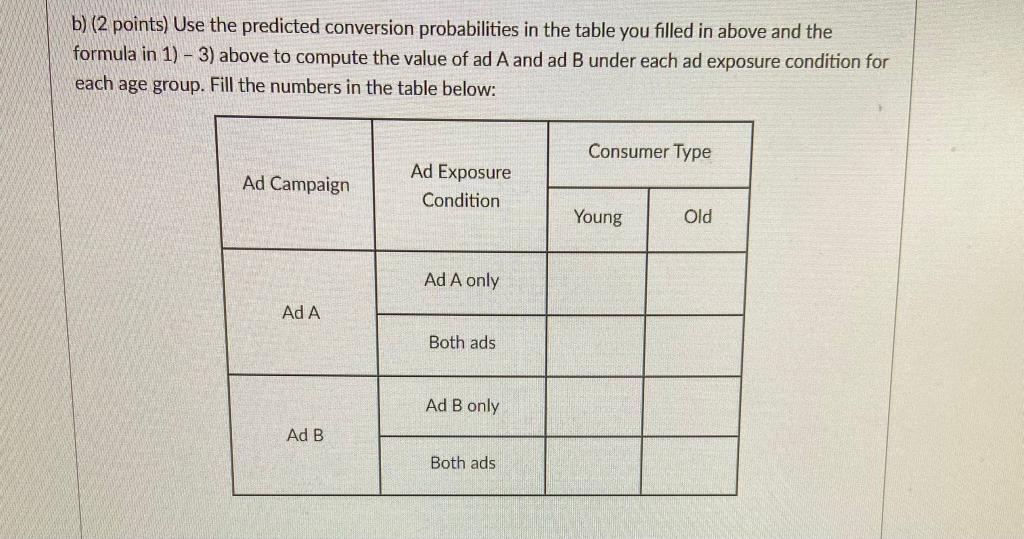
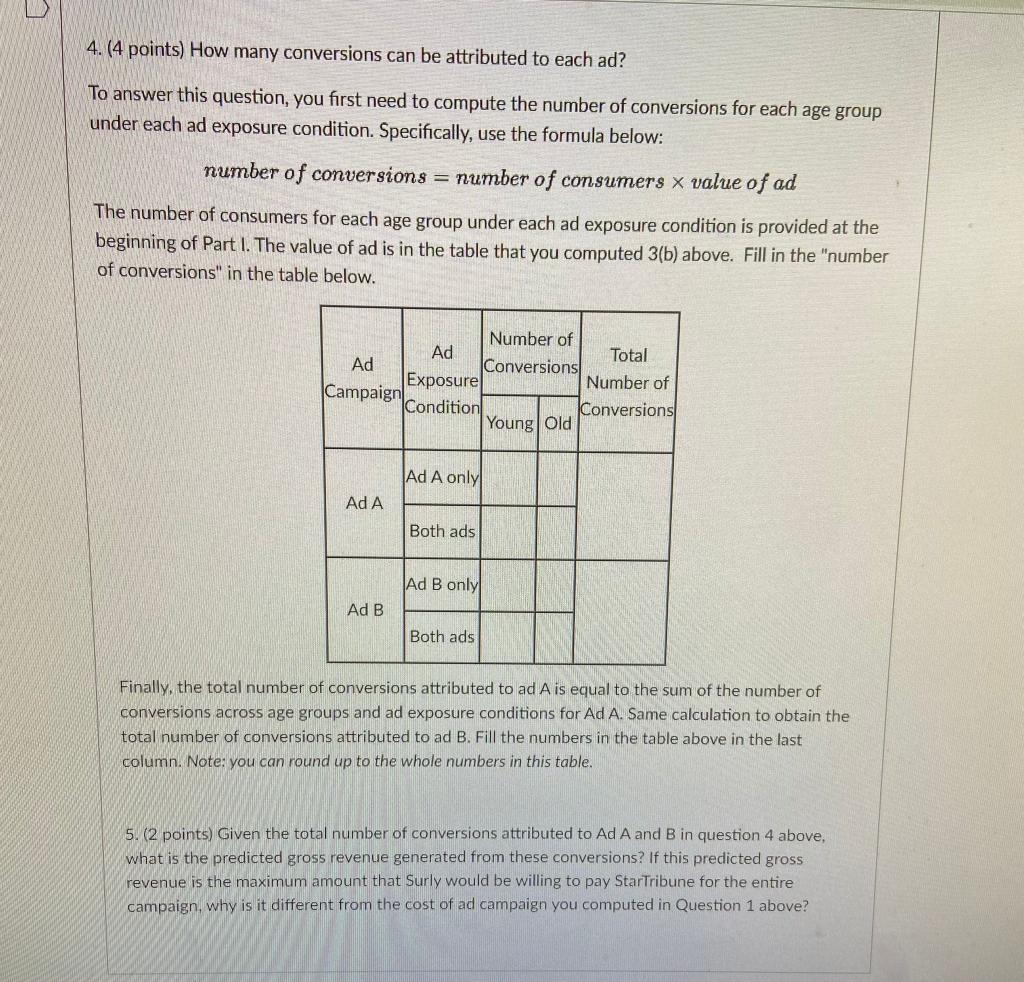
Background Information: The local brewery Surly launched a new product, a pale largely targeted towards the residents of the Twin Cities. To promote the new beer, Surly ran a digital campaign with two ads, Ad A and Ad B on the StarTribune website. Individuals who visited the StarTribune during the campaign period were exposed to each ad at most once. That is, some were exposed to neither ad, Ad A only, Ad B only, or both ads. For every exposure to one ad, Surly paid $0.3 to the platform. In the event that consumers bought the new beer, they spend $8 on average. Soon managers at Surly realized that they are better at brewing beer than running digital marketing campaigns, and so they hired you to analyze their campaign data and provide recommendations for improvement. Data: Surly collected data from 5000 individuals who visited the StarTribune website during the campaign period. The data include demographic information about each individual, indicators that represent ad exposure conditions, and whether or not each individual bought the new beer (i.e., conversion). For the demographics, consumers younger than 35 years old are classified as "Young", or else are classified as "Old." The following table presents a description of the variables in the data. Description Variable User Young Unique user identifier Indicates whether the individual is young or old. Young 1 if the individual is younger than 35, and 0 otherwise. Ad A Indicates whether Ad A is shown to the individual. Ad_A=1 if Ad A is shown to the individual, and 0 otherwise. Ad B Indicates whether Ad B is shown to the individual. Ad_B=1 if Ad B is shown to the individual, and 0 otherwise. Conversion Indicates whether the individual converted. Convertion=1 if the individual converted, and 0 otherwise. Based on the initial understanding of the data, Surly obtained the following information: . Out of the 5,000 individuals, there were 2,652 total impressions to at least one ad. 202 out of the individuals who were exposed to at least one ad ended up purchasing Surly beers after the exposure. . 347 (out of the 5.000) individuals purchased Surly beers, no matter whether they were exposed to Surly's ad. . The table below presents the number of individuals in each age group (Young vs. Old) under each ad exposure condition. Note: you will use the numbers in this table for Question 4 below. Consumer Type Ad Exposure Condition Young Old Ad A only 459 411 Ad B only 527 527 1. (2 points) Based on the information about the data presented above, what is the acquisition cost per customer? What is the return on advertising spend (ROA) for the entire campaign? Note that ROA= Gross Revenue from Ad Campaign Cost of Ad Campaign 2. In order to optimize the campaign, Surly first wants to determine how different ad copies affect conversion probability, holding age constant. A binary logit model is run using "conversion" as the dependent variable and the demographic and ad exposure indicators as independent variables. More specifically, the model equation is as follows: Prob (conversion = 1) = exp(3+8.Young+B AdA+B Ads+B Ad AdB) 1+exp(B+B Young+B AdA+B3 Adg+84 Ada Ada) Note that the last term in the model, labeled as "AdA "Adg." equals to 1 if a person was exposed to both ads; O otherwise. Including this last term helps to identify the influence on conversion probability when both ads were shown to an individual. Standard deviations P-values Parameters -3.5945 Intercept 0.1277 2.0E-174 Young 1.1613 0.1281 1.2E-19 Ad A 0.5602 0.1466 0.000 Ad B 0.3339 0.1472 0.023 Ad A Ad B 0.0126 0.2488 0.960 Based on the parameter estimates above, answer the following question: a) (4 points) Does consumer age have a significant impact on the conversion rate? In other words, is the likelihood of purchase different between young and old consumers? If so, how? b) (2 point) Would showing both ads to an individual increase the probability of conversion? TE 3. We could measure the effectiveness of each ad (labeled as "value" of each ad) using the incremental conversion probability it could generate. That is, the value of each ad can be computed as follows: 1) For those who only saw ad A. Value (Ad A) Pr(Conversion/Ad A only) - Pr(Conversion/No ads) 3. We could measure the effectiveness of each ad (labeled as "value" of each ad) using the incremental conversion probability it could generate. That is, the value of each ad can be computed as follows: 1) For those who only saw ad A, Value (Ad A) = Pr(Conversion Ad A only) - Pr(Conversion/No ads) 2) For those who only saw ad B, Value (Ad B) = Pr(Conversion/Ad B only) - Pr(Conversion/No ads) 3) For those who saw both ads, Value (Ad A) = Pr(Conversion|Both ads) - Pr(Conversion|Ad B only); Value (Ad B) = Pr(Conversion Both ads) - Pr(Conversion Ad A only). a) (4 points) Predict the conversion probability under each ad exposure condition for each consumer age group. To do so, you can use the parameter estimates and the logit model equation in question 2 above to compute Pr(Conversion Ad A only), Pr(Conversion Ad B only), Pr(Conversion|Both ads), and Pr(Conversion No ads) for each consumer age group (Young or Old). Fill the numbers in the table below: Consumer Type Ad Exposure Condition Old Ad A only Ad B only Both ads No ads Young b) (2 points) Use the predicted conversion probabilities in the table you filled in above and the formula in 1)-3) above to compute the value of ad A and ad B under each ad exposure condition for each age group. Fill the numbers in the table below: Consumer Type Ad Exposure Ad Campaign Condition Old Ad A only Ad A Both ads Ad B only Ad B Both Young 4. (4 points) How many conversions can be attributed to each ad? To answer this question, you first need to compute the number of conversions for each age group under each ad exposure condition. Specifically, use the formula below: number of conversions = number of consumers x value of ad The number of consumers for each age group under each ad exposure condition is provided at the beginning of Part I. The value of ad is in the table that you computed 3(b) above. Fill in the "number of conversions" in the table below. Number of Conversions Ad Exposure Ad Total Number of Conversions Campaign Condition Young Old Ad A only Ad A Both ads Ad B only Ad B Both ads Finally, the total number of conversions attributed to ad A is equal to the sum of the number of conversions across age groups and ad exposure conditions for Ad A. Same calculation to obtain the total number of conversions attributed to ad B. Fill the numbers in the table above in the last column. Note: you can round up to the whole numbers in this table. 5. (2 points) Given the total number of conversions attributed to Ad A and B in question 4 above, what is the predicted gross revenue generated from these conversions? If this predicted gross revenue is the maximum amount that Surly would be willing to pay StarTribune for the entire campaign, why is it different from the cost of ad campaign you computed in Question 1 above? Background Information: The local brewery Surly launched a new product, a pale largely targeted towards the residents of the Twin Cities. To promote the new beer, Surly ran a digital campaign with two ads, Ad A and Ad B on the StarTribune website. Individuals who visited the StarTribune during the campaign period were exposed to each ad at most once. That is, some were exposed to neither ad, Ad A only, Ad B only, or both ads. For every exposure to one ad, Surly paid $0.3 to the platform. In the event that consumers bought the new beer, they spend $8 on average. Soon managers at Surly realized that they are better at brewing beer than running digital marketing campaigns, and so they hired you to analyze their campaign data and provide recommendations for improvement. Data: Surly collected data from 5000 individuals who visited the StarTribune website during the campaign period. The data include demographic information about each individual, indicators that represent ad exposure conditions, and whether or not each individual bought the new beer (i.e., conversion). For the demographics, consumers younger than 35 years old are classified as "Young", or else are classified as "Old." The following table presents a description of the variables in the data. Description Variable User Young Unique user identifier Indicates whether the individual is young or old. Young 1 if the individual is younger than 35, and 0 otherwise. Ad A Indicates whether Ad A is shown to the individual. Ad_A=1 if Ad A is shown to the individual, and 0 otherwise. Ad B Indicates whether Ad B is shown to the individual. Ad_B=1 if Ad B is shown to the individual, and 0 otherwise. Conversion Indicates whether the individual converted. Convertion=1 if the individual converted, and 0 otherwise. Based on the initial understanding of the data, Surly obtained the following information: . Out of the 5,000 individuals, there were 2,652 total impressions to at least one ad. 202 out of the individuals who were exposed to at least one ad ended up purchasing Surly beers after the exposure. . 347 (out of the 5.000) individuals purchased Surly beers, no matter whether they were exposed to Surly's ad. . The table below presents the number of individuals in each age group (Young vs. Old) under each ad exposure condition. Note: you will use the numbers in this table for Question 4 below. Consumer Type Ad Exposure Condition Young Old Ad A only 459 411 Ad B only 527 527 1. (2 points) Based on the information about the data presented above, what is the acquisition cost per customer? What is the return on advertising spend (ROA) for the entire campaign? Note that ROA= Gross Revenue from Ad Campaign Cost of Ad Campaign 2. In order to optimize the campaign, Surly first wants to determine how different ad copies affect conversion probability, holding age constant. A binary logit model is run using "conversion" as the dependent variable and the demographic and ad exposure indicators as independent variables. More specifically, the model equation is as follows: Prob (conversion = 1) = exp(3+8.Young+B AdA+B Ads+B Ad AdB) 1+exp(B+B Young+B AdA+B3 Adg+84 Ada Ada) Note that the last term in the model, labeled as "AdA "Adg." equals to 1 if a person was exposed to both ads; O otherwise. Including this last term helps to identify the influence on conversion probability when both ads were shown to an individual. Standard deviations P-values Parameters -3.5945 Intercept 0.1277 2.0E-174 Young 1.1613 0.1281 1.2E-19 Ad A 0.5602 0.1466 0.000 Ad B 0.3339 0.1472 0.023 Ad A Ad B 0.0126 0.2488 0.960 Based on the parameter estimates above, answer the following question: a) (4 points) Does consumer age have a significant impact on the conversion rate? In other words, is the likelihood of purchase different between young and old consumers? If so, how? b) (2 point) Would showing both ads to an individual increase the probability of conversion? TE 3. We could measure the effectiveness of each ad (labeled as "value" of each ad) using the incremental conversion probability it could generate. That is, the value of each ad can be computed as follows: 1) For those who only saw ad A. Value (Ad A) Pr(Conversion/Ad A only) - Pr(Conversion/No ads) 3. We could measure the effectiveness of each ad (labeled as "value" of each ad) using the incremental conversion probability it could generate. That is, the value of each ad can be computed as follows: 1) For those who only saw ad A, Value (Ad A) = Pr(Conversion Ad A only) - Pr(Conversion/No ads) 2) For those who only saw ad B, Value (Ad B) = Pr(Conversion/Ad B only) - Pr(Conversion/No ads) 3) For those who saw both ads, Value (Ad A) = Pr(Conversion|Both ads) - Pr(Conversion|Ad B only); Value (Ad B) = Pr(Conversion Both ads) - Pr(Conversion Ad A only). a) (4 points) Predict the conversion probability under each ad exposure condition for each consumer age group. To do so, you can use the parameter estimates and the logit model equation in question 2 above to compute Pr(Conversion Ad A only), Pr(Conversion Ad B only), Pr(Conversion|Both ads), and Pr(Conversion No ads) for each consumer age group (Young or Old). Fill the numbers in the table below: Consumer Type Ad Exposure Condition Old Ad A only Ad B only Both ads No ads Young b) (2 points) Use the predicted conversion probabilities in the table you filled in above and the formula in 1)-3) above to compute the value of ad A and ad B under each ad exposure condition for each age group. Fill the numbers in the table below: Consumer Type Ad Exposure Ad Campaign Condition Old Ad A only Ad A Both ads Ad B only Ad B Both Young 4. (4 points) How many conversions can be attributed to each ad? To answer this question, you first need to compute the number of conversions for each age group under each ad exposure condition. Specifically, use the formula below: number of conversions = number of consumers x value of ad The number of consumers for each age group under each ad exposure condition is provided at the beginning of Part I. The value of ad is in the table that you computed 3(b) above. Fill in the "number of conversions" in the table below. Number of Conversions Ad Exposure Ad Total Number of Conversions Campaign Condition Young Old Ad A only Ad A Both ads Ad B only Ad B Both ads Finally, the total number of conversions attributed to ad A is equal to the sum of the number of conversions across age groups and ad exposure conditions for Ad A. Same calculation to obtain the total number of conversions attributed to ad B. Fill the numbers in the table above in the last column. Note: you can round up to the whole numbers in this table. 5. (2 points) Given the total number of conversions attributed to Ad A and B in question 4 above, what is the predicted gross revenue generated from these conversions? If this predicted gross revenue is the maximum amount that Surly would be willing to pay StarTribune for the entire campaign, why is it different from the cost of ad campaign you computed in Question 1 above
Step by Step Solution
There are 3 Steps involved in it
Step: 1

Get Instant Access to Expert-Tailored Solutions
See step-by-step solutions with expert insights and AI powered tools for academic success
Step: 2

Step: 3

Ace Your Homework with AI
Get the answers you need in no time with our AI-driven, step-by-step assistance
Get Started


