Question
Background: SpecDine Inc, located in Guelph, Ontario, is a manufacturer of dining tables and chairs. The company employs 50 employees. Alex McGill is the new
Background:
SpecDine Inc, located in Guelph, Ontario, is a manufacturer of dining tables and chairs. The company employs 50 employees. Alex McGill is the new plant operations manager, and he has been very concerned about the increasing problem with rejected products found during the manufacturing operations. Alex feels strongly that there are too many rejected products. He feels strongly that data must be collected and analyzed in order to begin fixing the problems.
As a newly hired operations analyst, you have been brought in to help review and analyze the quality data for SpecDine. Although you will not make technical recommendations, you should be able to help them figure out what the problems are and to point them in the right direction.
Your Task:
You have been asked to look at the quality data for the entire facility for the month of June. You have also been asked to tour the facility, gather information and make recommendations.
Process Overview:
There are two production lines, one for the tables and the other one for the chairs. The chair legs are made by a local supplier, while tabletops, table legs and all other wooden pieces are manufactured in-house. Any nuts and bolts used in the assembly are purchased from outside suppliers.
For each production line, there is one inspector at the end of the line who performs 100% inspection, and two employees who package the products and load them onto a skid for delivery to the warehouse. Each table is packaged into its own box, designed to include the tabletop and legs. There are two sizes of tables, a 4-person and a 6-person. Each type of table has its own package of the right size. In addition, every two chairs are put into one box that is designed specifically to include the two chairs. The chair size is standard across all chairs. Note that the chairs are shipped to customers fully assembled, while the tables are to be assembled by the customer (due to their bigger sizes).
Currently, the products that are found faulty at the final inspection are to be sent to a special team of 2 employees, in the repair department. These employees are responsible for evaluating, repairing and documenting their work. Any product that cannot be repaired is designated as "scrap" and sent to the garbage/recycling. There is a constant supply of products waiting to be evaluated by the repair team.
After being repaired, products are returned to the final inspection area at the end of the production line that they came from. The inspector must look at the repaired product to make sure that it has been properly fixed. The inspector is often needed to work overtime to inspect the products that arrive from the repair department.
Components and raw materials for the production lines are received in large quantities from two local lumber companies and some other suppliers located overseas. After inspection and storage, quantities for one day's production are sent directly to the different workstations of the production lines, every night for the next day's production. Goods that do not pass receiving inspection are held, and sent back to suppliers. There is a backlog of goods waiting to be returned to suppliers.
Your Actions:
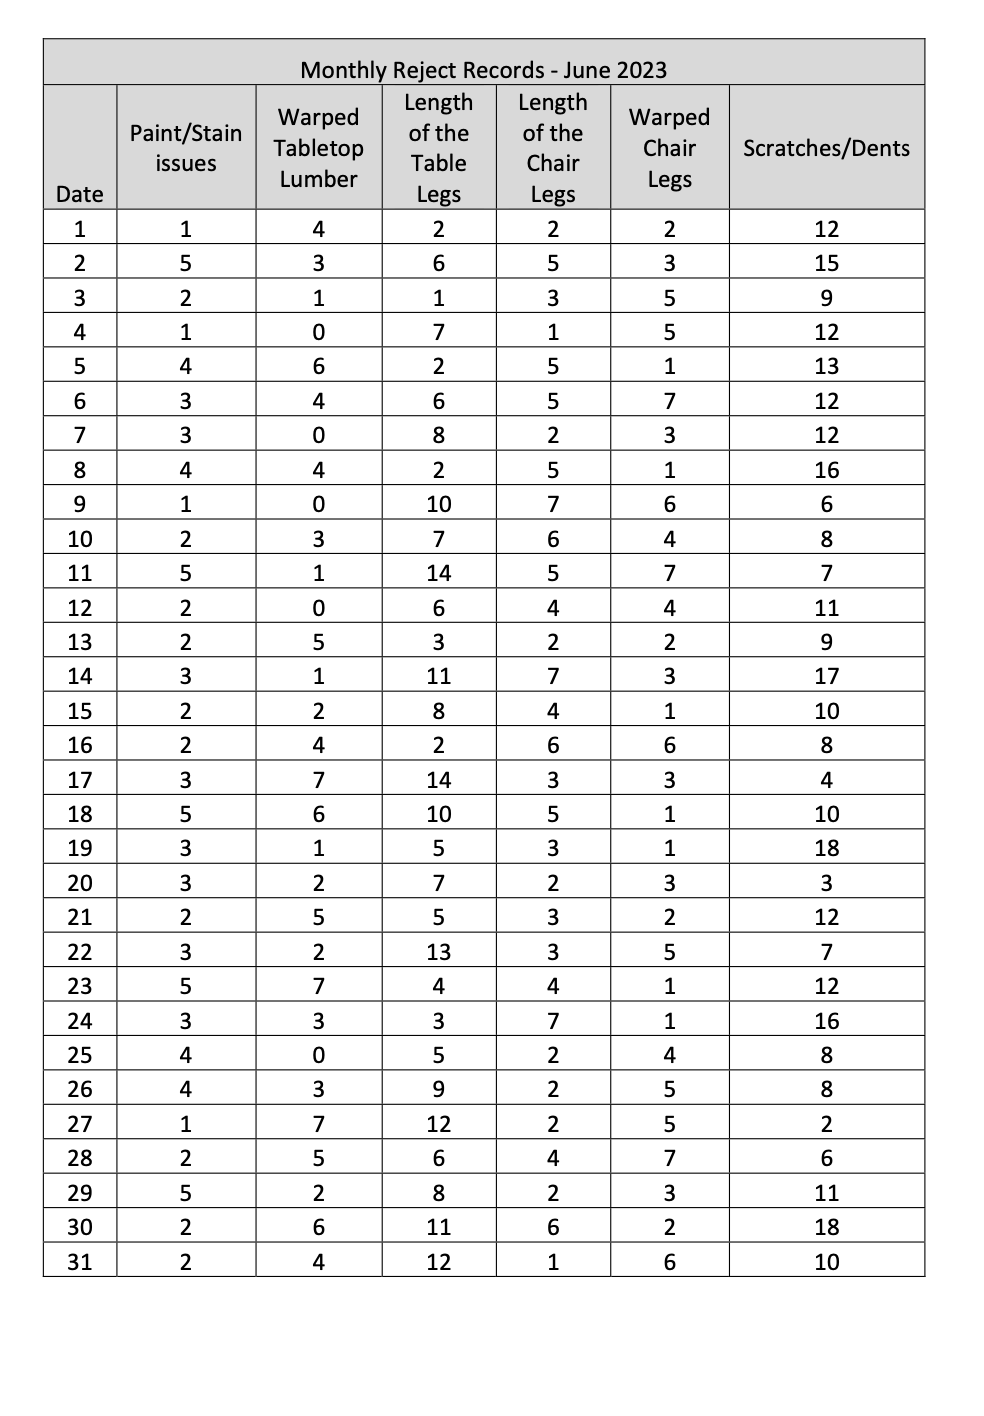
Your discussions with supervisors in the facility did not yield any definite clues as to the reasons for all the defects. There seemed to be many different types of rejects piled in various locations throughout the facility. The production line employees seem to be experienced, but do complain about being rushed to complete the orders. Your next stop was at the Quality Control Department, where you obtained the records for the Production Department rejects, for June 2023 (provided at the end of this document, and on the posted Excel file for the Collected Data).
Assignment:
Please submit an Excel file with your answers to the following questions:
Question 1 (4 marks) Draw a Fish-Bone (Cause and Effect) diagram, which indicates some possible reasons for the defects listed in the case.
Question 2 (6 marks) Perform a Pareto Analysis for the monthly Reject Log of the production process. What issues should be addressed first?
Question 3 (3 marks) Draw a Run Chart (Line Chart) for each of the top 2 defects indicated on your Pareto Chart, using the monthly reject data.
Question 4 (2 marks) From the information you have discovered, give your TWO main recommendations that SpecDine should address in order to solve the problems they are facing.
? Please put the answer to each question on a separate worksheet (similar to our assignment #1).
? The charts and graphs must be generated using Excel.
? Please remember to identify your charts/graphs- Main Titles, X-Axis and Y-Axis Titles and
Scale, other names of data.

Step by Step Solution
There are 3 Steps involved in it
Step: 1

Get Instant Access to Expert-Tailored Solutions
See step-by-step solutions with expert insights and AI powered tools for academic success
Step: 2

Step: 3

Ace Your Homework with AI
Get the answers you need in no time with our AI-driven, step-by-step assistance
Get Started


