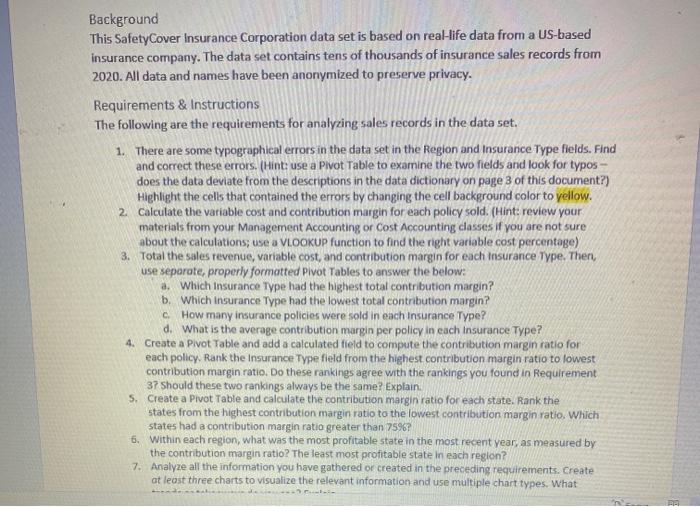
Background This Safety Cover Insurance Corporation data set is based on real-life data from a US-based insurance company. The data set contains tens of thousands of insurance sales records from 2020. All data and names have been anonymized to preserve privacy. Requirements & Instructions The following are the requirements for analyzing sales records in the data set. 1. There are some typographical errors in the data set in the Region and Insurance Type fields. Find and correct these errors. (Hint: use a Pivot Table to examine the two fields and look for typos - does the data deviate from the descriptions in the data dictionary on page 3 of this document?) Highlight the cells that contained the errors by changing the cell background color to yellow. 2. Calculate the variable cost and contribution margin for each policy sold. (Hint: review your materials from your Management Accounting or Cost Accounting classes if you are not sure about the calculations; use a VLOOKUP function to find the right variable cost percentage) 3. Total the sales revenue, variable cost, and contribution margin for each Insurance Type. Then, use separote, properly formatted Pivot Tables to answer the below: a. Which Insurance Type had the highest total contribution margin? b. Which Insurance. Type had the lowest total contribution margin? c. How many insurance policies were sold in each Insurance Type? d. What is the average contribution margin per policy in each Insurance Type? 4. Create a Pivot Table and add a calculated field to compute the contribution margin ratio for each policy. Rank the Insurance type field from the highest contribution margin ratio to lowest contribution margin ratio. Do these rankings agree with the rankings you found in Requirement 37 Should these two rankings always be the same? Explain. 5. Create a Pivot Table and calculate the contribution margin ratio for each state. Rank the states from the highest contribution margin ratio to the lowest contribution margin ratio. Which states had a contribution margin ratio greater than 75%? 6. Within each region, what was the most profitable state in the most recent year, as measured by the contribution margin ratio? The least most profitable state in each region? 7. Analyze all the information you have gathered or created in the preceding requirements. Create at least three charts to visualize the relevant information and use multiple chart types. What Background This Safety Cover Insurance Corporation data set is based on real-life data from a US-based insurance company. The data set contains tens of thousands of insurance sales records from 2020. All data and names have been anonymized to preserve privacy. Requirements & Instructions The following are the requirements for analyzing sales records in the data set. 1. There are some typographical errors in the data set in the Region and Insurance Type fields. Find and correct these errors. (Hint: use a Pivot Table to examine the two fields and look for typos - does the data deviate from the descriptions in the data dictionary on page 3 of this document?) Highlight the cells that contained the errors by changing the cell background color to yellow. 2. Calculate the variable cost and contribution margin for each policy sold. (Hint: review your materials from your Management Accounting or Cost Accounting classes if you are not sure about the calculations; use a VLOOKUP function to find the right variable cost percentage) 3. Total the sales revenue, variable cost, and contribution margin for each Insurance Type. Then, use separote, properly formatted Pivot Tables to answer the below: a. Which Insurance Type had the highest total contribution margin? b. Which Insurance. Type had the lowest total contribution margin? c. How many insurance policies were sold in each Insurance Type? d. What is the average contribution margin per policy in each Insurance Type? 4. Create a Pivot Table and add a calculated field to compute the contribution margin ratio for each policy. Rank the Insurance type field from the highest contribution margin ratio to lowest contribution margin ratio. Do these rankings agree with the rankings you found in Requirement 37 Should these two rankings always be the same? Explain. 5. Create a Pivot Table and calculate the contribution margin ratio for each state. Rank the states from the highest contribution margin ratio to the lowest contribution margin ratio. Which states had a contribution margin ratio greater than 75%? 6. Within each region, what was the most profitable state in the most recent year, as measured by the contribution margin ratio? The least most profitable state in each region? 7. Analyze all the information you have gathered or created in the preceding requirements. Create at least three charts to visualize the relevant information and use multiple chart types. What