Answered step by step
Verified Expert Solution
Link Copied!

Question

1 Approved Answer

Background Unplanned absences can be costly to organizations. Especially when activities must occur at a specific time, processes have to be stopped, or other employees

Background

Unplanned absences can be costly to organizations. Especially when activities must occur at a specific time, processes have to be stopped, or other employees then have to perform the work of the absent employees. The COO of your company, Burdock Industries (BI), recently reviewed the People Operations dashboard you set up for senior management in your organization. She is very concerned about a rising trend in unplanned absences this year and that this may be negatively impacting the business. She has asked the CHRO if the People Analytics team could conduct some research to try and uncover what might be driving* the increases in unplanned absences at BI and share recommendations on how to address this alarming trend.

After conducting interviews with leaders, frontline managers and even some employees, as well as reading the latest research on drivers and consequences of absenteeism, you have identified some potential factors associated with unplanned absences that you would like to include in your quantitative analysis. These include the number of OT hours worked, commute time and turnover intention.

Questions:

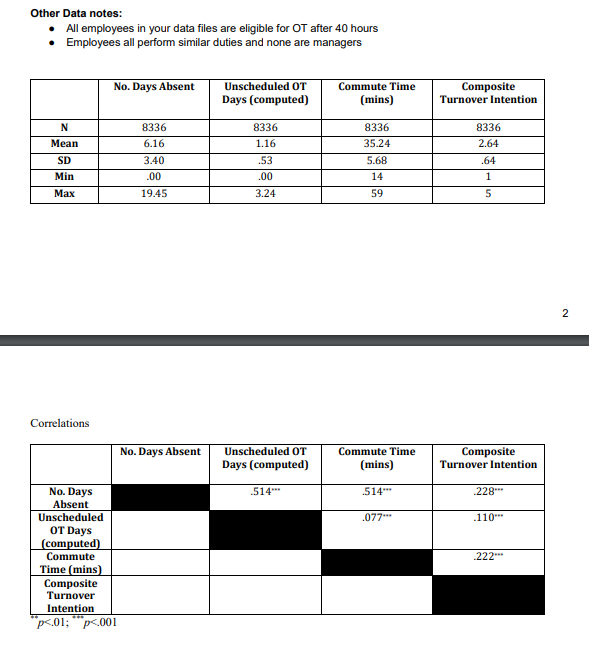
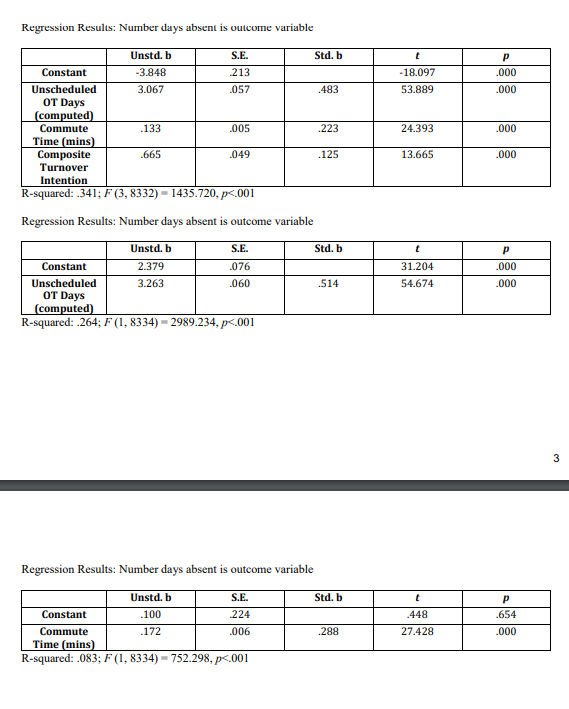
  • What numbers should I use below to build a scatterplot to identify the relationship between 3 variables (OT hours, commute time, and TO intention) with outcome variable (unplanned absences)?
  • How or what does those number tells me about the correlation?
  • I'm unclear how to or which number to look at to make analysis
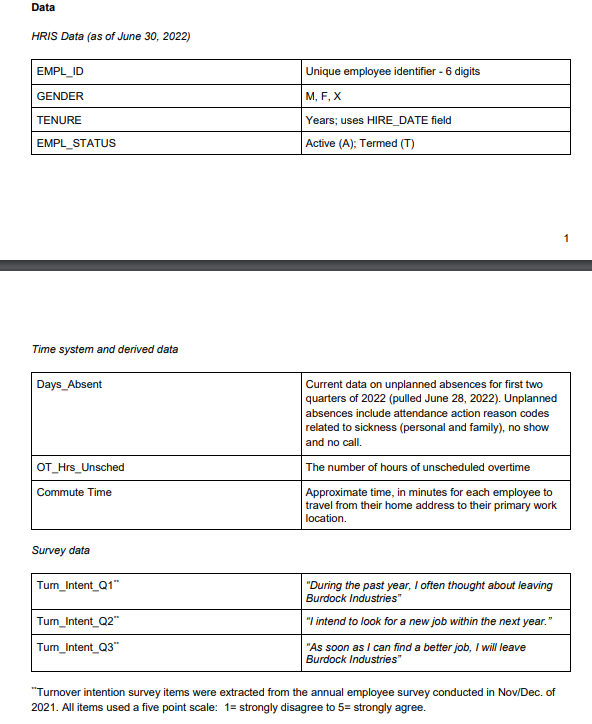
image text in transcribedimage text in transcribedimage text in transcribed
Data HRIS Data (as of June 30, 2022) EMPL_ID Unique employee identifier - 6 digits GENDER M, F, X TENURE Years; uses HIRE_DATE field EMPL_STATUS Active (A); Termed (T) Time system and derived data Days_Absent Current data on unplanned absences for first two quarters of 2022 (pulled June 28, 2022). Unplanned absences include attendance action reason codes related to sickness (personal and family), no show and no call. OT_Hrs_Unsched The number of hours of unscheduled overtime Commute Time Approximate time, in minutes for each employee to travel from their home address to their primary work location. Survey data Tum_Intent Q1" 'During the past year, I often thought about leaving Burdock Industries" Tum_Intent Q2" "I intend to look for a new job within the next year." Tum_Intent Q3" "As soon as I can find a better job, I will leave Burdock Industries" "Turnover intention survey items were extracted from the annual employee survey conducted in Nov/Dec. of 2021. All items used a five point scale: 1= strongly disagree to 5= strongly agree.Other Data notes: . All employees in your data files are eligible for OT after 40 hours Employees all perform similar duties and none are managers No. Days Absent Unscheduled OT Commute Time Composite Days (computed) [mins) Turnover Intention N 3336 8336 8336 3336 Mean 6.16 1.16 35.24 2.64 SD 3.40 53 5.68 64 Min .00 00 14 1 Max 19.45 3.24 59 5 2 Correlations No. Days Absent Unscheduled OT Commute Time Composite Days (computed) (mins) Turnover Intention No. Days 514." 228- Absent Unscheduled 077- OT Days (computed) Commute 222.= Time (mins) Composite Turnover Intention 401: p5.001Regression Results: Number days absent is outcome variable Unstd. b p Constant -3.848 .213 -18.097 .000 Unscheduled 3.067 057 53.889 OT Days (computed) Commute 133 005 24.393 000 Time (mins) Composite -665 049 13.665 000 Turnover Intention K-squared: .341: F (3, 8332) - 1435.720, p<.001 regression results: number days absent is outcome variable unstd. b s.e. std. p constant .000 unscheduled .514 ot r-squared: .264: f .654 commute time .083:>

Step by Step Solution

There are 3 Steps involved in it

Step: 1

blur-text-image

Get Instant Access to Expert-Tailored Solutions

See step-by-step solutions with expert insights and AI powered tools for academic success

Step: 2

blur-text-image

Step: 3

blur-text-image

Ace Your Homework with AI

Get the answers you need in no time with our AI-driven, step-by-step assistance

Get Started

Recommended Textbook for

Linear Algebra and Its Applications

Authors: David C. Lay

4th edition

321791541, 978-0321388834, 978-0321791542

More Books

Students also viewed these Mathematics questions

Question

Explain what FIFO means.

Answered: 1 week ago

Question

C(30, 17) x^13 (-2)^17 how does C(30, 17) relate to x^13 (-2)^17

Answered: 1 week ago