Answered step by step
Verified Expert Solution
Question
1 Approved Answer
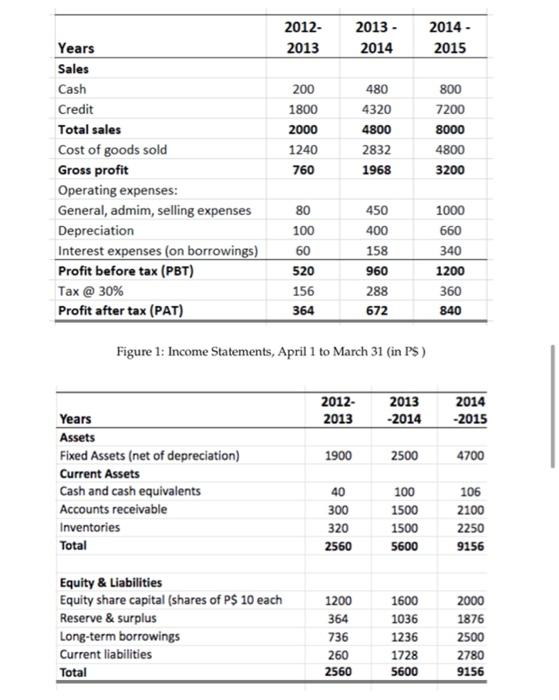
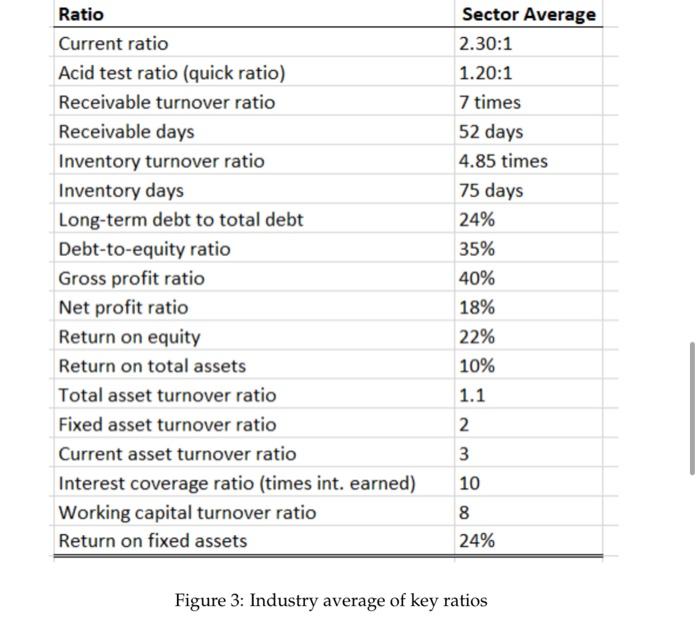
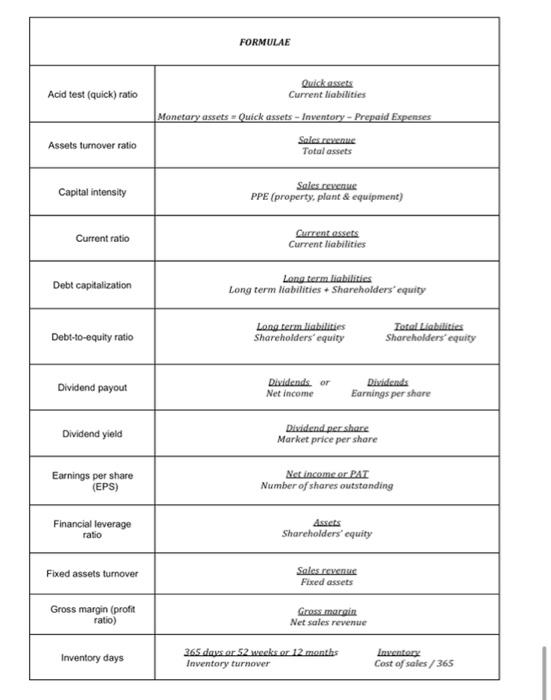
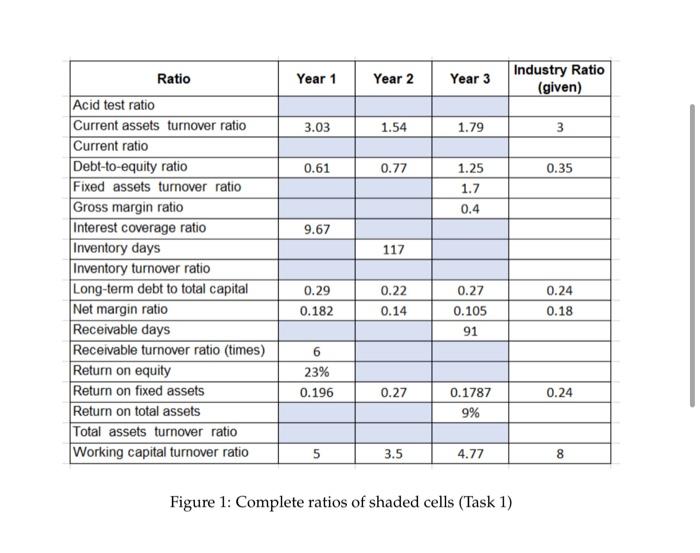
baded on financial statement and fomula to finish the table (year1-3) 2012- 2013 2013 - 2014 2014 - 2015 200 1800 2000 1240 760 480
baded on financial statement and fomula to finish the table (year1-3) 


2012- 2013 2013 - 2014 2014 - 2015 200 1800 2000 1240 760 480 4320 4800 2832 1968 800 7200 8000 4800 3200 Years Sales Cash Credit Total sales Cost of goods sold Gross profit Operating expenses: General, admim, selling expenses Depreciation Interest expenses (on borrowings) Profit before tax (PBT) Tax @ 30% Profit after tax (PAT) 450 400 80 100 60 520 156 364 1000 660 340 1200 158 960 288 672 360 840 Figure 1: Income Statements, April 1 to March 31 (in PS) 2012- 2013 2013 -2014 2014 -2015 1900 2500 4700 Years Assets Fixed Assets (net of depreciation) Current Assets Cash and cash equivalents Accounts receivable Inventories Total 40 300 320 2560 100 1500 1500 5600 106 2100 2250 9156 Equity & Liabilities Equity share capital (shares of P$ 10 each Reserve & surplus Long-term borrowings Current liabilities Total 1200 364 736 260 2560 1600 1036 1236 1728 5600 2000 1876 2500 2780 9156 Ratio Current ratio Acid test ratio (quick ratio) Receivable turnover ratio Receivable days Inventory turnover ratio Inventory days Long-term debt to total debt Debt-to-equity ratio Gross profit ratio Net profit ratio Return on equity Return on total assets Total asset turnover ratio Fixed asset turnover ratio Current asset turnover ratio Interest coverage ratio (times int. earned) Working capital turnover ratio Return on fixed assets Sector Average 2.30:1 1.20:1 7 times 52 days 4.85 times 75 days 24% 35% 40% 18% 22% 10% 1.1 2 3 10 8 24% Figure 3: Industry average of key ratios FORMULAE Acid test (quick) ratio Quick assets Current liabilities Monetary assets #Quick assets - Inventory - Prepaid Expenses Sales revenue Total assets Assets turnover ratio Capital intensity Sales revenue PPE (property, plant & equipment) Current ratio Current assets Current liabilities Debt capitalization Long term liabilities Long term liabilities + Shareholders' equity Debt-to-equity ratio Long term liabilities Shareholders' equity Total Liabilities Shareholders' equity Dividend payout Dividends or Net income Dividends Earnings per share Dividend yield Dividend per share Market price per share Earnings per share (EPS) Not income or PAT Number of shares outstanding Financial leverage ratio Assets Shareholders' equity Fixed assets turnover Sales revenue Fixed assets Gross margin (profit ratio) Gross margir Net sales revenue Inventory days 365 days or 52 weeks or 12 months Inventory turnover Inventor Cost of sales/365 Year 1 Year 2 Year 3 Industry Ratio (given) 3.03 1.54 1.79 3 0.61 0.77 1.25 0.35 1.7 0.4 9.67 117 Ratio Acid test ratio Current assets turnover ratio Current ratio Debt-to-equity ratio Fixed assets turnover ratio Gross margin ratio Interest coverage ratio Inventory days Inventory turnover ratio Long-term debt to total capital Net margin ratio Receivable days Receivable turnover ratio (times) Return on equity Return on fixed assets Return on total assets Total assets turnover ratio Working capital turnover ratio 0.29 0.182 0.22 0.14 0.27 0.105 0.24 0.18 91 6 23% 0.196 0.27 0.24 0.1787 9% 5 3.5 4.77 8 Figure 1: Complete ratios of shaded cells (Task 1) 


Step by Step Solution
There are 3 Steps involved in it
Step: 1

Get Instant Access to Expert-Tailored Solutions
See step-by-step solutions with expert insights and AI powered tools for academic success
Step: 2

Step: 3

Ace Your Homework with AI
Get the answers you need in no time with our AI-driven, step-by-step assistance
Get Started


