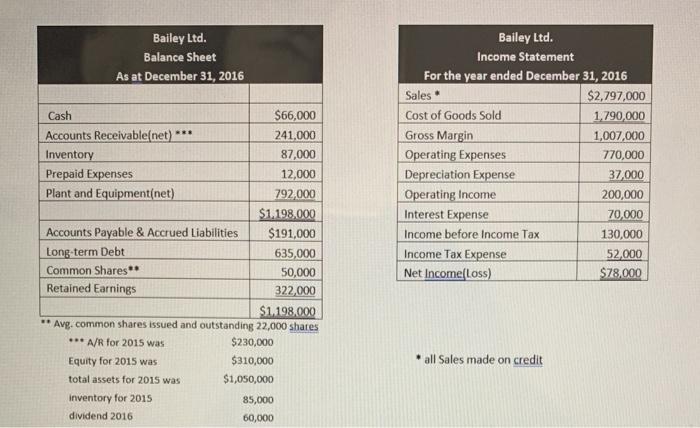
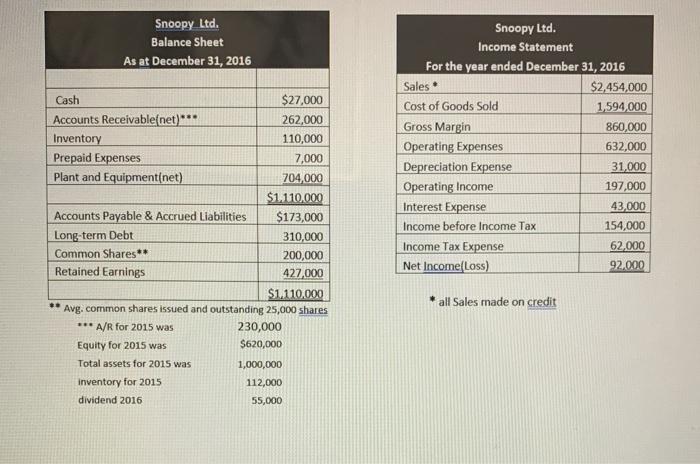
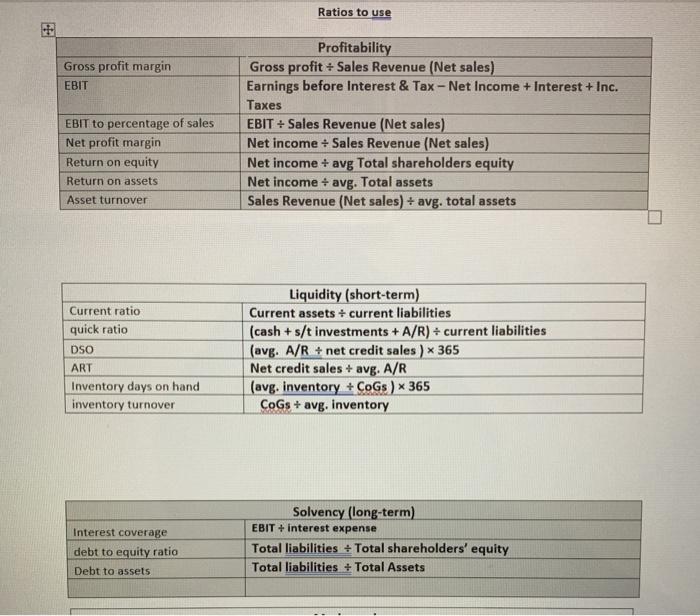
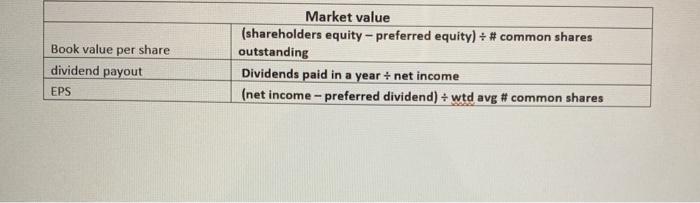
Bailey Ltd. Balance Sheet As at December 31, 2016 88 Cash $66,000 Accounts Receivable(net) 241,000 Inventory 87,000 Prepaid Expenses 12,000 Plant and Equipment(net) 792,000 $1.198,000 Accounts Payable & Accrued Liabilities $191,000 Long-term Debt 635,000 Common Shares 50,000 Retained Earnings 322,000 $1.198,000 ** Avg.common shares issued and outstanding 22,000 shares *** A/R for 2015 was $230,000 Equity for 2015 was $310,000 total assets for 2015 was $1,050,000 Inventory for 2015 85,000 dividend 2016 60,000 Bailey Ltd. Income Statement For the year ended December 31, 2016 Sales $2,797,000 Cost of Goods Sold 1.790,000 Gross Margin 1,007,000 Operating Expenses 770,000 Depreciation Expense 37,000 Operating Income 200,000 Interest Expense 70,000 Income before Income Tax 130,000 Income Tax Expense 52,000 Net Incomefloss) $78,000 all Sales made on credit Snoopy Ltd. Balance Sheet As at December 31, 2016 Cash $27,000 Accounts Receivable(net)*** 262,000 Inventory 110,000 Prepaid Expenses 7,000 Plant and Equipment(net) 704,000 $1.110,000 Accounts Payable & Accrued Liabilities $173,000 Long-term Debt 310,000 Common Shares** 200,000 Retained Earnings 427,000 $1.110,000 Avg. common shares issued and outstanding 25,000 shares *** A/R for 2015 was 230,000 Equity for 2015 was $620,000 Total assets for 2015 was 1,000,000 inventory for 2015 112,000 dividend 2016 55,000 Snoopy Ltd. Income Statement For the year ended December 31, 2016 Sales $2,454,000 Cost of Goods Sold 1,594,000 Gross Margin 860,000 Operating Expenses 632,000 Depreciation Expense 31.000 Operating Income 197,000 Interest Expense 43,000 Income before Income Tax 154,000 Income Tax Expense 62,000 Net Income(Loss) 92.000 .. * all Sales made on credit Ratios to use Gross profit margin EBIT EBIT to percentage of sales Net profit margin Return on equity Return on assets Profitability Gross profit + Sales Revenue (Net sales) Earnings before Interest & Tax - Net Income + Interest + Inc. Taxes EBIT + Sales Revenue (Net sales) Net income + Sales Revenue (Net sales) Net income + avg Total shareholders equity Net income + avg. Total assets Sales Revenue (Net sales) + avg. total assets Asset turnover Current ratio quick ratio DSO ART Inventory days on hand inventory turnover Liquidity (short-term) Current assets + current liabilities (cash + s/t investments + A/R) + current liabilities (avg. A/R + net credit sales ) * 365 Net credit sales + avg. A/R (avg. Inventory + CoGs) * 365 CoGs + avg. Inventory Interest coverage debt to equity ratio Debt to assets Solvency (long-term) EBIT + interest expense Total liabilities + Total shareholders' equity Total liabilities + Total Assets Book value per share dividend payout EPS Market value (shareholders equity - preferred equity) + # common shares outstanding Dividends paid in a year + net income (net income - preferred dividend) : wtd avg# common shares