Answered step by step
Verified Expert Solution
Link Copied!

Question

1 Approved Answer

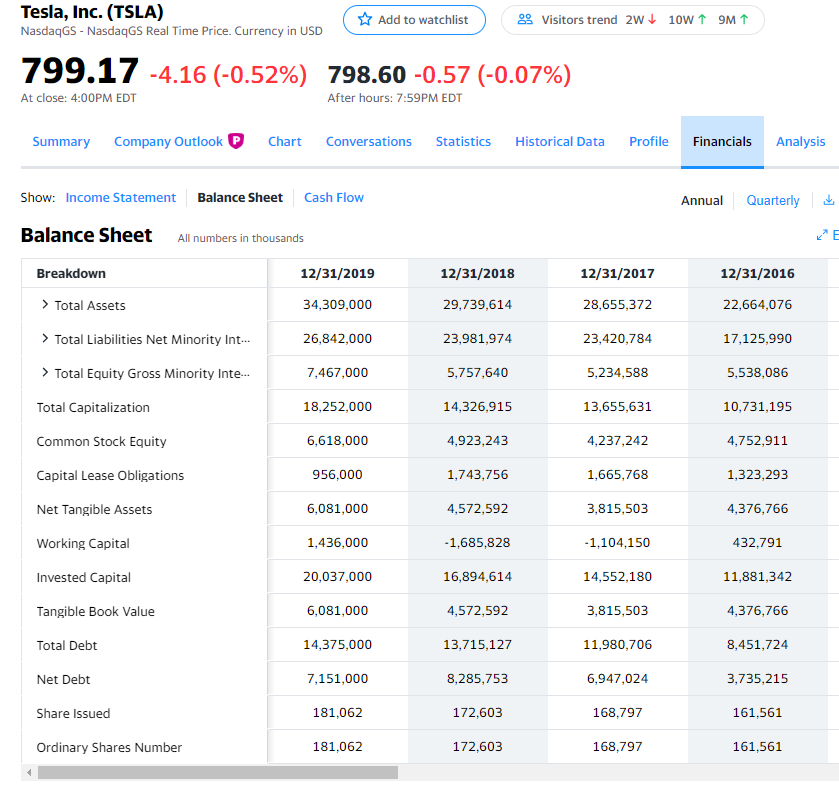
Balance Sheet Analysis for Tesla Identify off-balance sheet exposure and identify impact to leverage and repayment. Discuss access to a variety of capital markets segments

Balance Sheet Analysis for Tesla

  • Identify off-balance sheet exposure and identify impact to leverage and repayment.
  • Discuss access to a variety of capital markets segments to support business plan assumptions about need for growth capital.
  • Major changes in assets/liabilities
  • Significant trends in liquidity, working capital and balance sheet ratios. Analysis by business segment

image text in transcribed

Tesla, Inc. (TSLA) Nasdaqs - NasdaqGs Real Time Price. Currency in USD Add to watchlist 29 Visitors trend 2w10w1 9M 1 799.17 -4.16 (-0.52%) 798.60 -0.57 (-0.07%) At close: 4:00PM EDT After hours: 7:59PM EDT Summary Company Outlook P Chart Conversations Statistics Historical Data Profile Financials Analysis Show: Income Statement Balance Sheet Cash Flow Annual Quarterly Balance Sheet All numbers in thousands Breakdown 12/31/2019 12/31/2018 12/31/2017 12/31/2016 > Total Assets 34,309,000 29,739,614 28,655,372 22,664,076 > Total Liabilities Net Minority Int... 26,842,000 23,981,974 23,420,784 17,125,990 > Total Equity Gross Minority Inte... 7,467,000 5,757,640 5,234,588 5,538,086 Total Capitalization 18,252,000 14,326,915 13,655,631 10,731,195 Common Stock Equity 6,618,000 4,923,243 4,237,242 4,752,911 Capital Lease Obligations 956,000 1,743,756 1,665,768 1,323,293 Net Tangible Assets 6,081,000 4,572,592 3,815,503 4,376,766 Working Capital 1,436,000 -1,685,828 -1,104,150 432,791 Invested Capital 20,037,000 16,894,614 14,552,180 11,881,342 Tangible Book Value 6,081,000 4,572,592 3,815,503 4,376,766 Total Debt 14,375,000 13,715,127 11,980,706 8,451,724 Net Debt 7,151,000 8,285,753 6,947,024 3,735,215 Share issued 181,062 172,603 168,797 161,561 Ordinary Shares Number 181,062 172,603 168,797 161,561 Tesla, Inc. (TSLA) Nasdaqs - NasdaqGs Real Time Price. Currency in USD Add to watchlist 29 Visitors trend 2w10w1 9M 1 799.17 -4.16 (-0.52%) 798.60 -0.57 (-0.07%) At close: 4:00PM EDT After hours: 7:59PM EDT Summary Company Outlook P Chart Conversations Statistics Historical Data Profile Financials Analysis Show: Income Statement Balance Sheet Cash Flow Annual Quarterly Balance Sheet All numbers in thousands Breakdown 12/31/2019 12/31/2018 12/31/2017 12/31/2016 > Total Assets 34,309,000 29,739,614 28,655,372 22,664,076 > Total Liabilities Net Minority Int... 26,842,000 23,981,974 23,420,784 17,125,990 > Total Equity Gross Minority Inte... 7,467,000 5,757,640 5,234,588 5,538,086 Total Capitalization 18,252,000 14,326,915 13,655,631 10,731,195 Common Stock Equity 6,618,000 4,923,243 4,237,242 4,752,911 Capital Lease Obligations 956,000 1,743,756 1,665,768 1,323,293 Net Tangible Assets 6,081,000 4,572,592 3,815,503 4,376,766 Working Capital 1,436,000 -1,685,828 -1,104,150 432,791 Invested Capital 20,037,000 16,894,614 14,552,180 11,881,342 Tangible Book Value 6,081,000 4,572,592 3,815,503 4,376,766 Total Debt 14,375,000 13,715,127 11,980,706 8,451,724 Net Debt 7,151,000 8,285,753 6,947,024 3,735,215 Share issued 181,062 172,603 168,797 161,561 Ordinary Shares Number 181,062 172,603 168,797 161,561

Step by Step Solution

There are 3 Steps involved in it

Step: 1

blur-text-image

Get Instant Access to Expert-Tailored Solutions

See step-by-step solutions with expert insights and AI powered tools for academic success

Step: 2

blur-text-image

Step: 3

blur-text-image

Ace Your Homework with AI

Get the answers you need in no time with our AI-driven, step-by-step assistance

Get Started