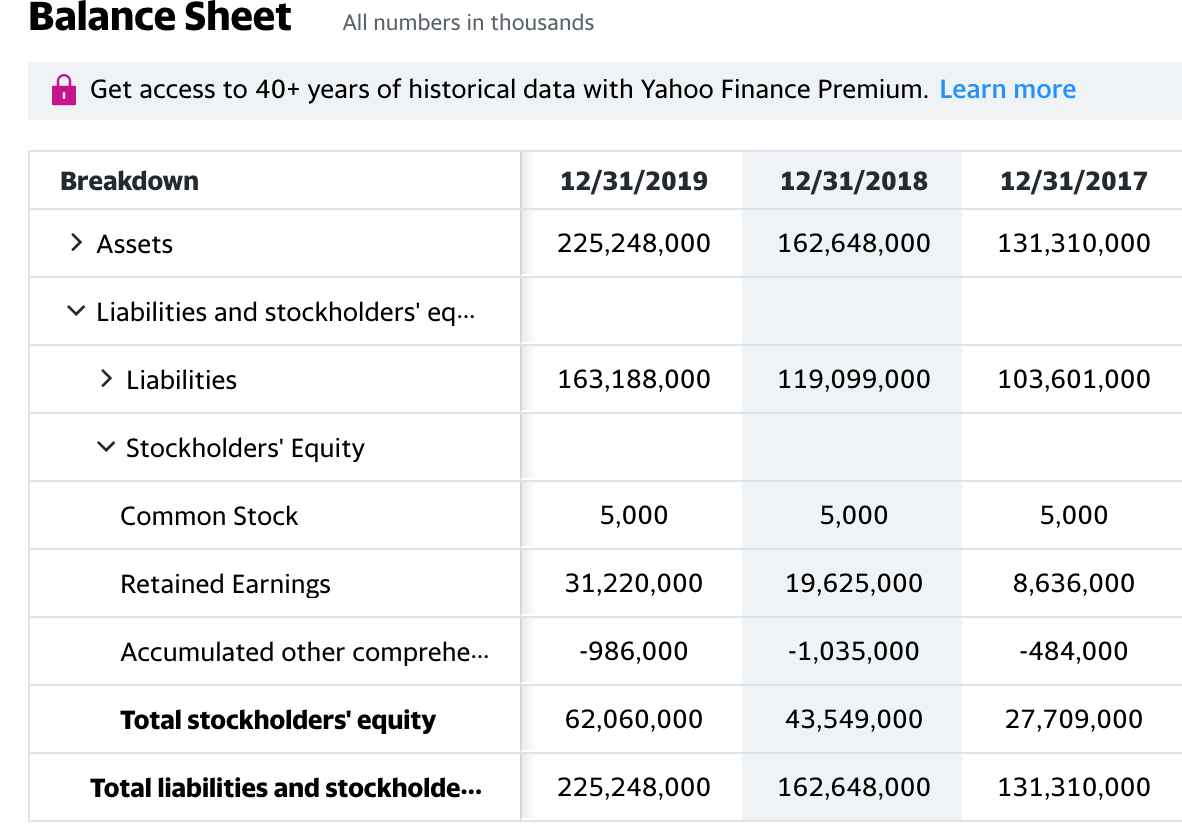
Balance Sheet Analysis: In this section, answer the following for the trend analysis: What are the total assets, liabilities and shareholder equity for the past 3 years for Amazon.com? How have these numbers changed over the three years and what could be some reasons why these numbers have changed the way they have? In addition, pick at least one appropriate (for this statement) ratio or financial in addition to what is provided and calculate that and explain it. See the section on ratio analysis below for ideas.
-
Ratio Analysis: In addition to the trend analysis above, it is customary to also analyze ratios. Some commonly used ratios are:
- Beta: A measure of risk that is usually published and not calculated by you (A beta greater than 1 suggests that the company is more volatile/risky than the market)
- Current ratio = Current Assets/Current Liabilities (A current ratio greater than 1 means the company has enough assets to cover all current liabilities should the need arise)
- Quick ratio = (Current Assets Inventory)/Current Liabilities (When you are dealing with a company that carries a lot of inventory, a quick ratio is a better indicator than a current ratio because it acknowledges that inventory is not typically liquid).
- Profit Margin = Net Income/Sales (Represents how much of each dollar in sales remains after all costs are covered)
- Return on Equity = Net income/Total equity (Represents the return for all holders of equity in that company)
- EBIT Return on Assets = EBIT/Total assets (Represents the pre-tax return on the total net investment in the firm from operations or alternatively, how efficiently management has used assets)
- Debt-equity ratio = Total debt/Total equity (Represents the long term solvency or financial leverage in that company)
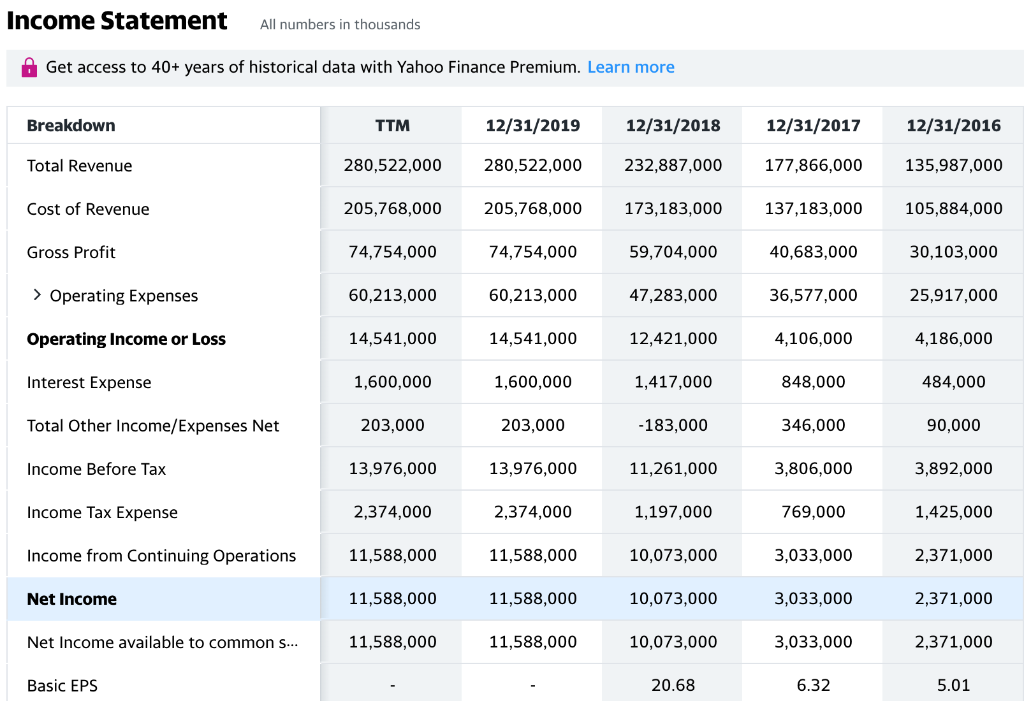
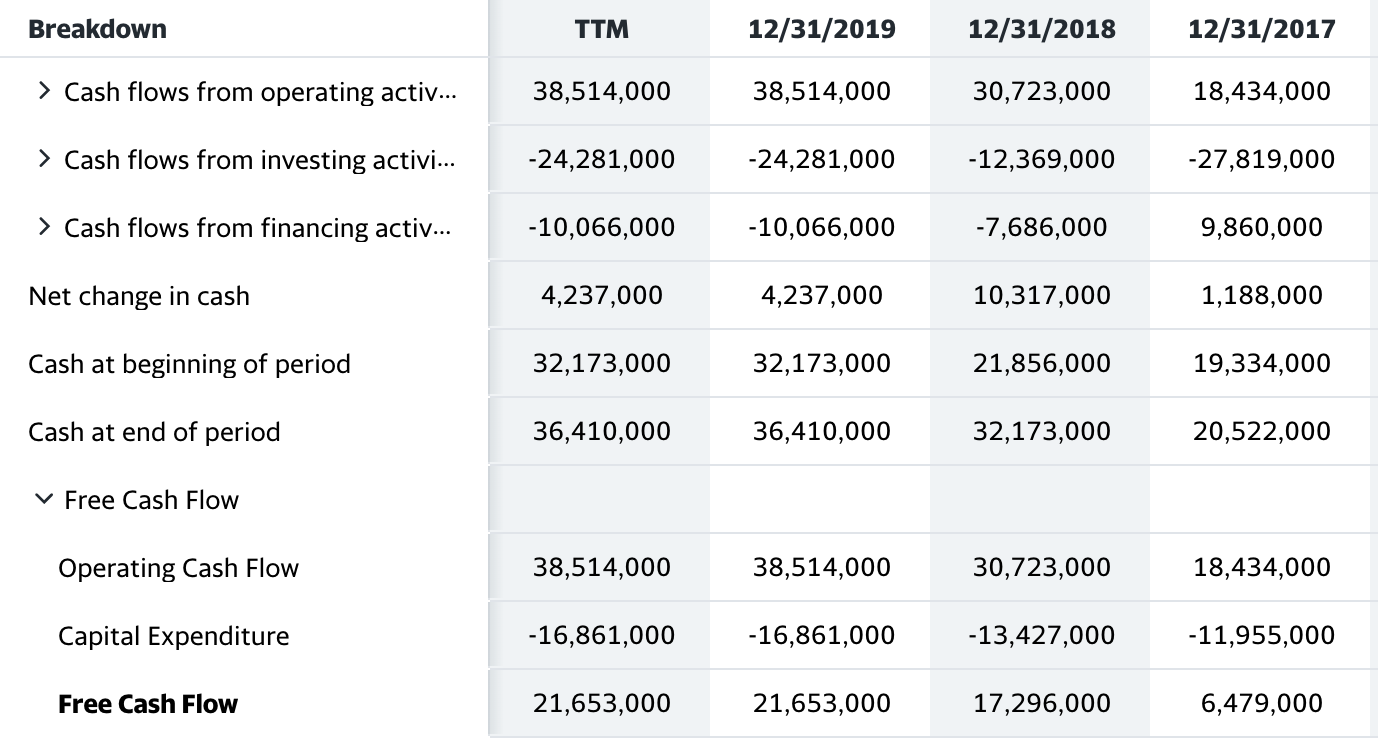
Income Statement All numbers in thousands A Get access to 40+ years of historical data with Yahoo Finance Premium. Learn more Breakdown TTM 12/31/2019 12/31/2018 12/31/2017 12/31/2016 Total Revenue 280,522,000 280,522,000 232,887,000 177,866,000 135,987,000 Cost of Revenue 205,768,000 205,768,000 173,183,000 137,183,000 105,884,000 Gross Profit 74,754,000 74,754,000 59,704,000 40,683,000 30,103,000 > Operating Expenses 60,213,000 60,213,000 47,283,000 36,577,000 25,917,000 Operating Income or Loss 14,541,000 14,541,000 12,421,000 4,106,000 4,186,000 Interest Expense 1,600,000 1,600,000 1,417,000 848,000 484,000 Total Other Income/Expenses Net 203,000 203,000 -183,000 346,000 90,000 Income Before Tax 13,976,000 13,976,000 11,261,000 3,806,000 3,892,000 Income Tax Expense 2,374,000 2,374,000 1,197,000 769,000 1,425,000 Income from Continuing Operations 11,588,000 11,588,000 10,073,000 3,033,000 2,371,000 Net Income 11,588,000 11,588,000 10,073,000 3,033,000 2,371,000 Net Income available to common s... 11,588,000 11,588,000 10,073,000 3,033,000 2,371,000 Basic EPS 20.68 6.32 5.01 Breakdown TTM 12/31/2019 12/31/2018 12/31/2017 > Cash flows from operating activ... 38,514,000 38,514,000 30,723,000 18,434,000 > Cash flows from investing activi... -24,281,000 -24,281,000 -12,369,000 -27,819,000 > Cash flows from financing activ... -10,066,000 -10,066,000 -7,686,000 9,860,000 Net change in cash 4,237,000 4,237,000 10,317,000 1,188,000 Cash at beginning of period 32,173,000 32,173,000 21,856,000 19,334,000 Cash at end of period 36,410,000 36,410,000 32,173,000 20,522,000 v Free Cash Flow Operating Cash Flow 38,514,000 38,514,000 30,723,000 18,434,000 Capital Expenditure -16,861,000 -16,861,000 -13,427,000 -11,955,000 Free Cash Flow 21,653,000 21,653,000 17,296,000 6,479,000 All numbers in thousands 0 Get access to 40+ years of historical data with Yahoo Finance Premium. Learn more Breakdown 12/31/2019 12/31/2018 12/31/2017 > Assets 225,248,000 162,648,000 131,310,000 v Liabilities and stockholders' eq... > Liabilities 163,188,000 119,099,000 103,601,000 v Stockholders' Equity Common Stock 5,000 5,000 5,000 Retained Earnings 31,220,000 19,625,000 8,636,000 Accumulated other comprehe... -986,000 -1,035,000 -484,000 Total stockholders' equity 62,060,000 43,549,000 27,709,000 Total liabilities and stockholde... 225,248,000 162,648,000 131,310,000 Income Statement All numbers in thousands A Get access to 40+ years of historical data with Yahoo Finance Premium. Learn more Breakdown TTM 12/31/2019 12/31/2018 12/31/2017 12/31/2016 Total Revenue 280,522,000 280,522,000 232,887,000 177,866,000 135,987,000 Cost of Revenue 205,768,000 205,768,000 173,183,000 137,183,000 105,884,000 Gross Profit 74,754,000 74,754,000 59,704,000 40,683,000 30,103,000 > Operating Expenses 60,213,000 60,213,000 47,283,000 36,577,000 25,917,000 Operating Income or Loss 14,541,000 14,541,000 12,421,000 4,106,000 4,186,000 Interest Expense 1,600,000 1,600,000 1,417,000 848,000 484,000 Total Other Income/Expenses Net 203,000 203,000 -183,000 346,000 90,000 Income Before Tax 13,976,000 13,976,000 11,261,000 3,806,000 3,892,000 Income Tax Expense 2,374,000 2,374,000 1,197,000 769,000 1,425,000 Income from Continuing Operations 11,588,000 11,588,000 10,073,000 3,033,000 2,371,000 Net Income 11,588,000 11,588,000 10,073,000 3,033,000 2,371,000 Net Income available to common s... 11,588,000 11,588,000 10,073,000 3,033,000 2,371,000 Basic EPS 20.68 6.32 5.01 Breakdown TTM 12/31/2019 12/31/2018 12/31/2017 > Cash flows from operating activ... 38,514,000 38,514,000 30,723,000 18,434,000 > Cash flows from investing activi... -24,281,000 -24,281,000 -12,369,000 -27,819,000 > Cash flows from financing activ... -10,066,000 -10,066,000 -7,686,000 9,860,000 Net change in cash 4,237,000 4,237,000 10,317,000 1,188,000 Cash at beginning of period 32,173,000 32,173,000 21,856,000 19,334,000 Cash at end of period 36,410,000 36,410,000 32,173,000 20,522,000 v Free Cash Flow Operating Cash Flow 38,514,000 38,514,000 30,723,000 18,434,000 Capital Expenditure -16,861,000 -16,861,000 -13,427,000 -11,955,000 Free Cash Flow 21,653,000 21,653,000 17,296,000 6,479,000 All numbers in thousands 0 Get access to 40+ years of historical data with Yahoo Finance Premium. Learn more Breakdown 12/31/2019 12/31/2018 12/31/2017 > Assets 225,248,000 162,648,000 131,310,000 v Liabilities and stockholders' eq... > Liabilities 163,188,000 119,099,000 103,601,000 v Stockholders' Equity Common Stock 5,000 5,000 5,000 Retained Earnings 31,220,000 19,625,000 8,636,000 Accumulated other comprehe... -986,000 -1,035,000 -484,000 Total stockholders' equity 62,060,000 43,549,000 27,709,000 Total liabilities and stockholde... 225,248,000 162,648,000 131,310,000