Answered step by step
Verified Expert Solution
Link Copied!

Question

1 Approved Answer

Balance Sheet Analysis Your company has been in business for some time now, steadily building its revenue streams and implementing strategies for growth. Having gone

Balance Sheet Analysis

Your company has been in business for some time now, steadily building its revenue streams and implementing strategies for growth. Having gone public, you know the importance investors, creditors, and analysts place on various financial ratios and trends. You want to continue to act ethically, apply appropriate GAAP standards, and maintain high quality earnings. However, if there are areas where your company can improve financial ratios and trends, you want to take advantage of these opportunities and implement relevant strategies. For Module 12, your focus will be on the financial statement analysis.

Horizontal Analysis

Below is your comparative balance sheet. Using horizontal analysis, first calculate the amount of the change from Year 1 to Year 2. For accounts that decreased, enter amount as negative. For the last column, calculate the percentage change from Year 1 to Year 2. For amounts that decreased, enter as negative. For dollar amounts, do not enter commas, dollar signs, or decimals. For percentages, convert to percent format (e.g. 0.6543 to 65.43).

***********I need help with correcting Row 9, cell 5 on the horizontal balance sheet.*******
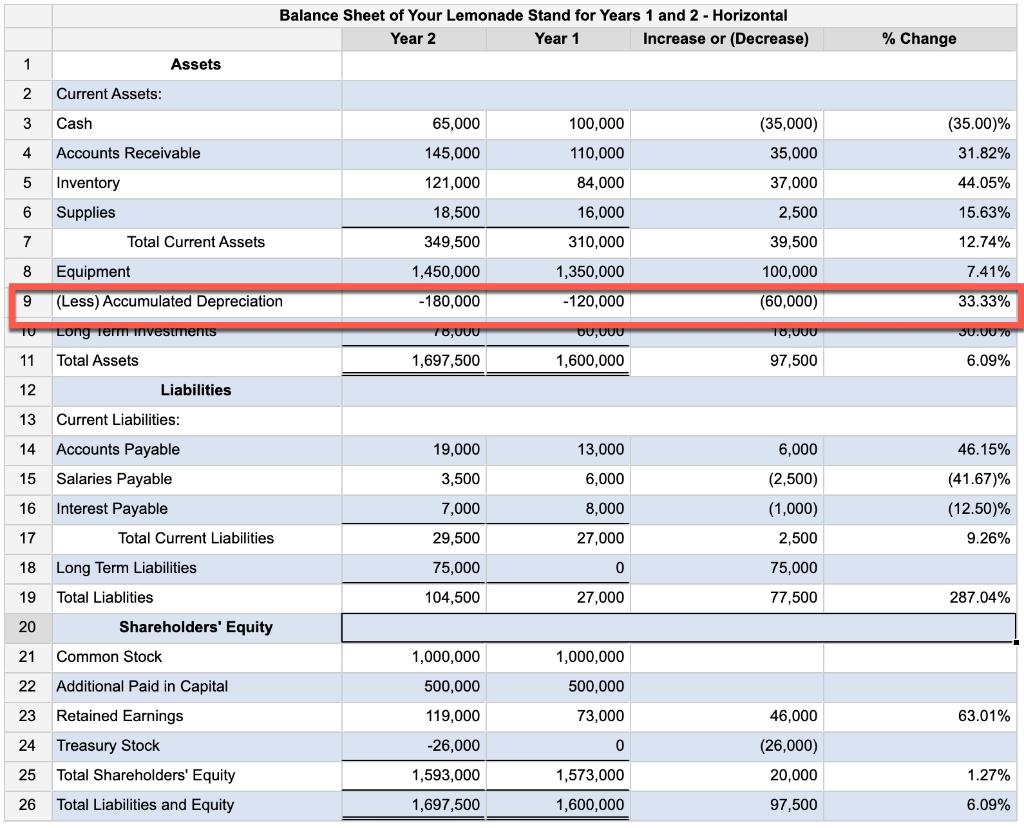
image text in transcribed

Vertical Analysis

Below is select information from your balance sheet. Perform vertical analysis for Year 2. For percentages, convert to percent format (e.g. 0.6543 to 65.43). Round answers to two decimal places.
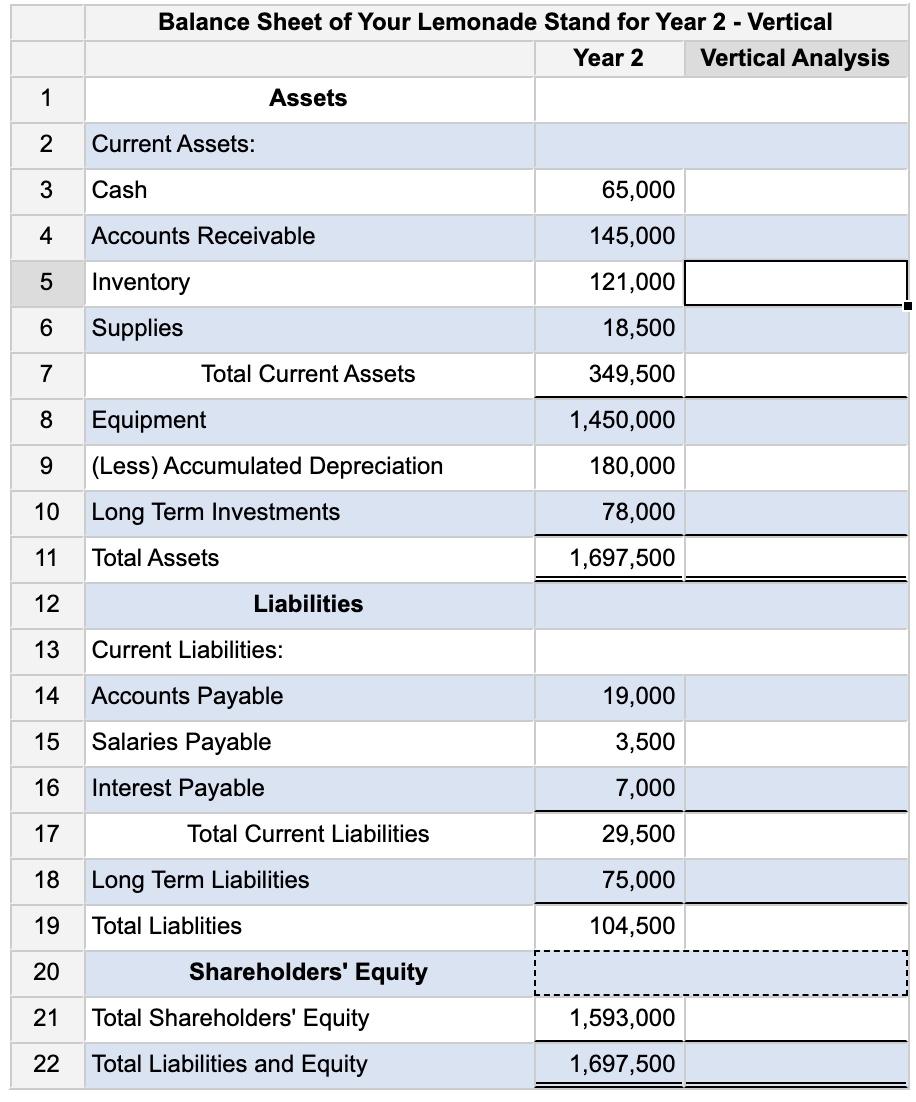
image text in transcribed

Balance Sheet of Your Lemonade Stand for Years 1 and 2 - Horizontal Year 2 Year 1 Increase or (Decrease) % Change 1 Assets 2 Current Assets: 3 Cash 100,000 65,000 145,000 (35,000) 35,000 (35.00)% 31.82% 4 Accounts Receivable 110,000 5 121,000 84,000 37,000 44.05% 6 Inventory Supplies Total Current Assets 18,500 16,000 2,500 15.63% 7 310,000 39,500 12.74% 349,500 1,450,000 8 1,350,000 100,000 7.41% Equipment (Less) Accumulated Depreciation 9 -180,000 -120,000 (60,000) 33.33% TU Long Term investments TOUUU OU, UUU TOUUU 30.00% 11 Total Assets 1,697,500 1,600,000 97,500 6.09% 12 Liabilities 13 Current Liabilities: 14 19,000 13,000 6,000 46.15% 15 3,500 6,000 Accounts Payable Salaries Payable Interest Payable Total Current Liabilities 16 7,000 8,000 (2,500) (1,000) 2,500 (41.67)% (12.50)% 9.26% 17 29,500 27,000 75,000 0 75,000 18 Long Term Liabilities 19 Total Liablities 104,500 27,000 77,500 287.04% 20 Shareholders' Equity 21 Common Stock 1,000,000 1,000,000 22 Additional Paid in Capital 500,000 500,000 73,000 23 Retained Earnings 119,000 63.01% -26,000 0 24 Treasury Stock 25 Total Shareholders' Equity 46,000 (26,000) 20,000 97,500 1.27% 1,593,000 1,697,500 1,573,000 1,600,000 26 Total Liabilities and Equity 6.09% Balance Sheet of Your Lemonade Stand for Year 2 - Vertical Year 2 Vertical Analysis 1 Assets 2 Current Assets: 3 Cash 65,000 4 Accounts Receivable 145,000 5 Inventory 121,000 6 Supplies 18,500 7 Total Current Assets 349,500 8 1,450,000 9 Equipment (Less) Accumulated Depreciation Long Term Investments 180,000 10 78,000 11 Total Assets 1,697,500 12 Liabilities 13 Current Liabilities: 14 19,000 15 Accounts Payable Salaries Payable Interest Payable 3,500 16 7,000 17 Total Current Liabilities 29,500 18 Long Term Liabilities 75,000 19 Total Liablities 104,500 20 Shareholders' Equity 21 Total Shareholders' Equity Total Liabilities and Equity 1,593,000 1,697,500 22

Step by Step Solution

There are 3 Steps involved in it

Step: 1

blur-text-image

Get Instant Access to Expert-Tailored Solutions

See step-by-step solutions with expert insights and AI powered tools for academic success

Step: 2

blur-text-image

Step: 3

blur-text-image

Ace Your Homework with AI

Get the answers you need in no time with our AI-driven, step-by-step assistance

Get Started

Recommended Textbook for

International Finance Discussion Papers The Information Content Of High Frequency Data For Estimating Equity Return Models And Forecasting Risk

Authors: United States Federal Reserve Board, Dobrislav P. Dobrev, Pawel J. Szerszen

1st Edition

1288724810, 9781288724819

More Books

Students also viewed these Finance questions