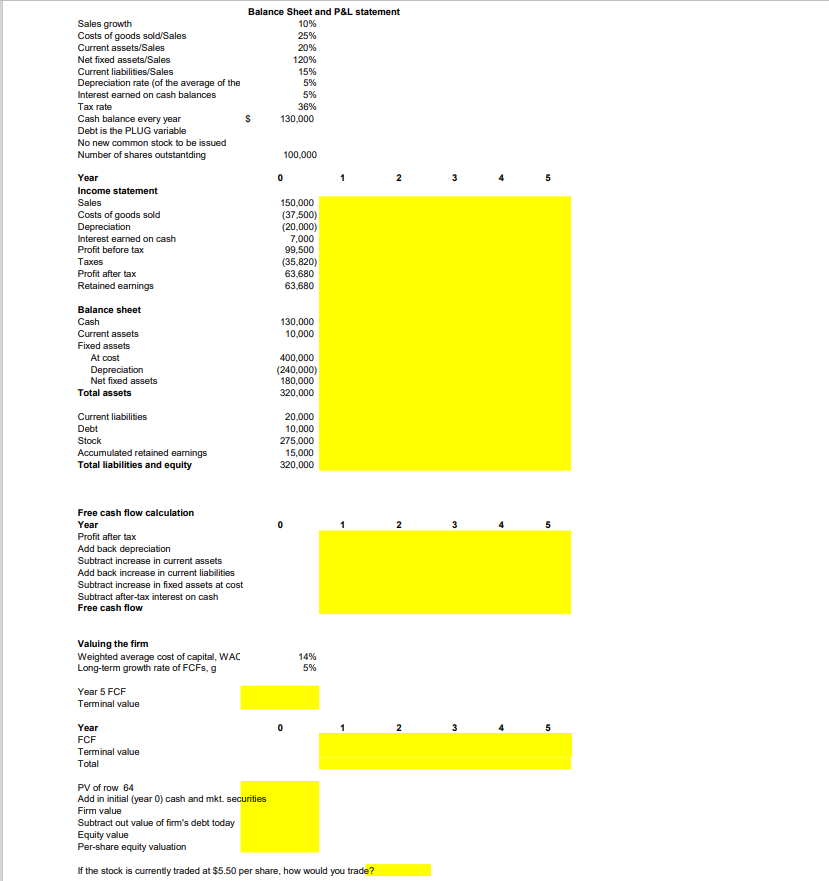
Balance Sheet and P&L statement Sales growth 10% Costs of goods sold/Sales 25% Current assets/Sales 20% Net fixed assets/Sales 120% Current liabilities/Sales 15% Depreciation rate of the average of the 5% Interest earned on cash balances 5% Tax rate 36% Cash balance every year $ 130,000 Debt is the PLUG variable No new common stock to be issued Number of shares outstantding 100,000 0 2 3 Year Income statement Sales Costs of goods sold Depreciation Interest earned on cash Profit before tax Taxes Profit after tax Retained earnings Balance sheet Cash Current assets Fixed assets At cost Depreciation Net fixed assets Total assets 150,000 (37,500) (20,000) 7,000 99,500 (35,820) 63.680 63,680 130,000 10,000 400,000 (240,000) 180,000 320,000 Current liabilities Debt Stock Accumulated retained earnings Total liabilities and equity 20,000 10,000 275,000 15,000 320,000 Free cash flow calculation Year Profit after tax Add back depreciation Subtract increase in current assets Add back increase in current liabilities Subtract increase in fixed assets at cost Subtract after-tax interest on cash Free cash flow 14% 5% Valuing the firm Weighted average cost of capital, WAC Long-term growth rate of FCF, 9 Year 5 FCF Terminal value 2 3 Year FCF Terminal value Total PV of row 64 Add in initial (year O) cash and mkt. securities Firm value Subtract out value of firm's debt today Equity value Per-share equity valuation If the stock is currently traded at $5.50 per share, how would you trade? Balance Sheet and P&L statement Sales growth 10% Costs of goods sold/Sales 25% Current assets/Sales 20% Net fixed assets/Sales 120% Current liabilities/Sales 15% Depreciation rate of the average of the 5% Interest earned on cash balances 5% Tax rate 36% Cash balance every year $ 130,000 Debt is the PLUG variable No new common stock to be issued Number of shares outstantding 100,000 0 2 3 Year Income statement Sales Costs of goods sold Depreciation Interest earned on cash Profit before tax Taxes Profit after tax Retained earnings Balance sheet Cash Current assets Fixed assets At cost Depreciation Net fixed assets Total assets 150,000 (37,500) (20,000) 7,000 99,500 (35,820) 63.680 63,680 130,000 10,000 400,000 (240,000) 180,000 320,000 Current liabilities Debt Stock Accumulated retained earnings Total liabilities and equity 20,000 10,000 275,000 15,000 320,000 Free cash flow calculation Year Profit after tax Add back depreciation Subtract increase in current assets Add back increase in current liabilities Subtract increase in fixed assets at cost Subtract after-tax interest on cash Free cash flow 14% 5% Valuing the firm Weighted average cost of capital, WAC Long-term growth rate of FCF, 9 Year 5 FCF Terminal value 2 3 Year FCF Terminal value Total PV of row 64 Add in initial (year O) cash and mkt. securities Firm value Subtract out value of firm's debt today Equity value Per-share equity valuation If the stock is currently traded at $5.50 per share, how would you trade


