

Answered step by step
Verified Expert Solution
Question
1 Approved Answer
Balance Sheet as of December 31, 2021 (millions of dollars) Income Statement for Year Ended December 31, 2021 (millions of dollars) Net sales Cost of
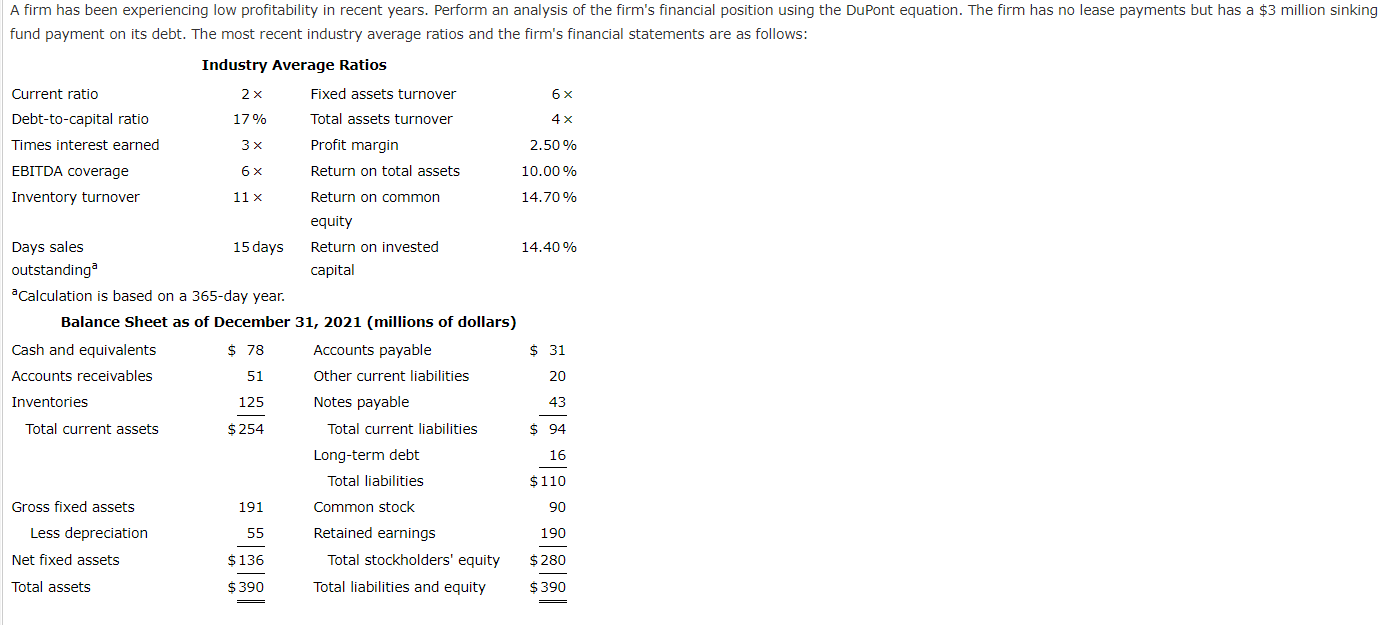
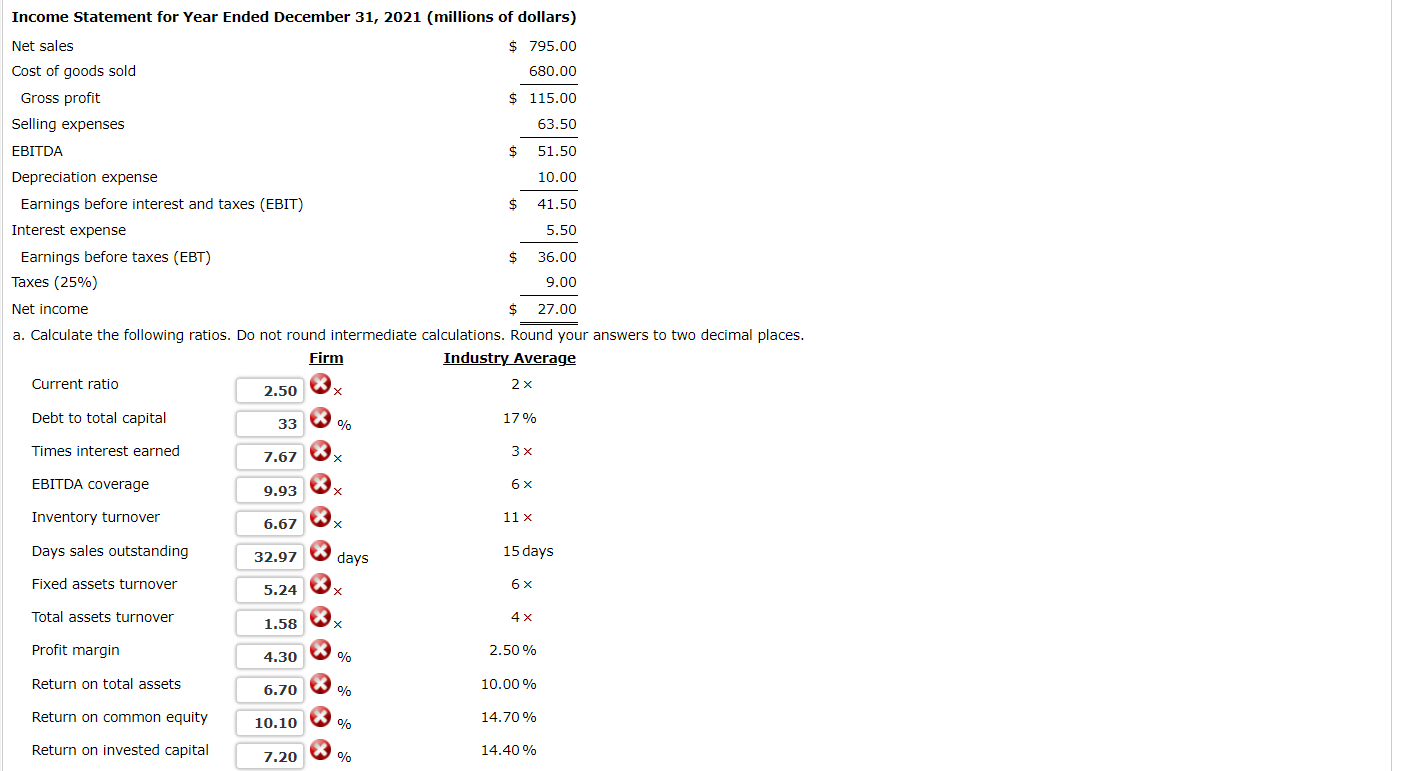
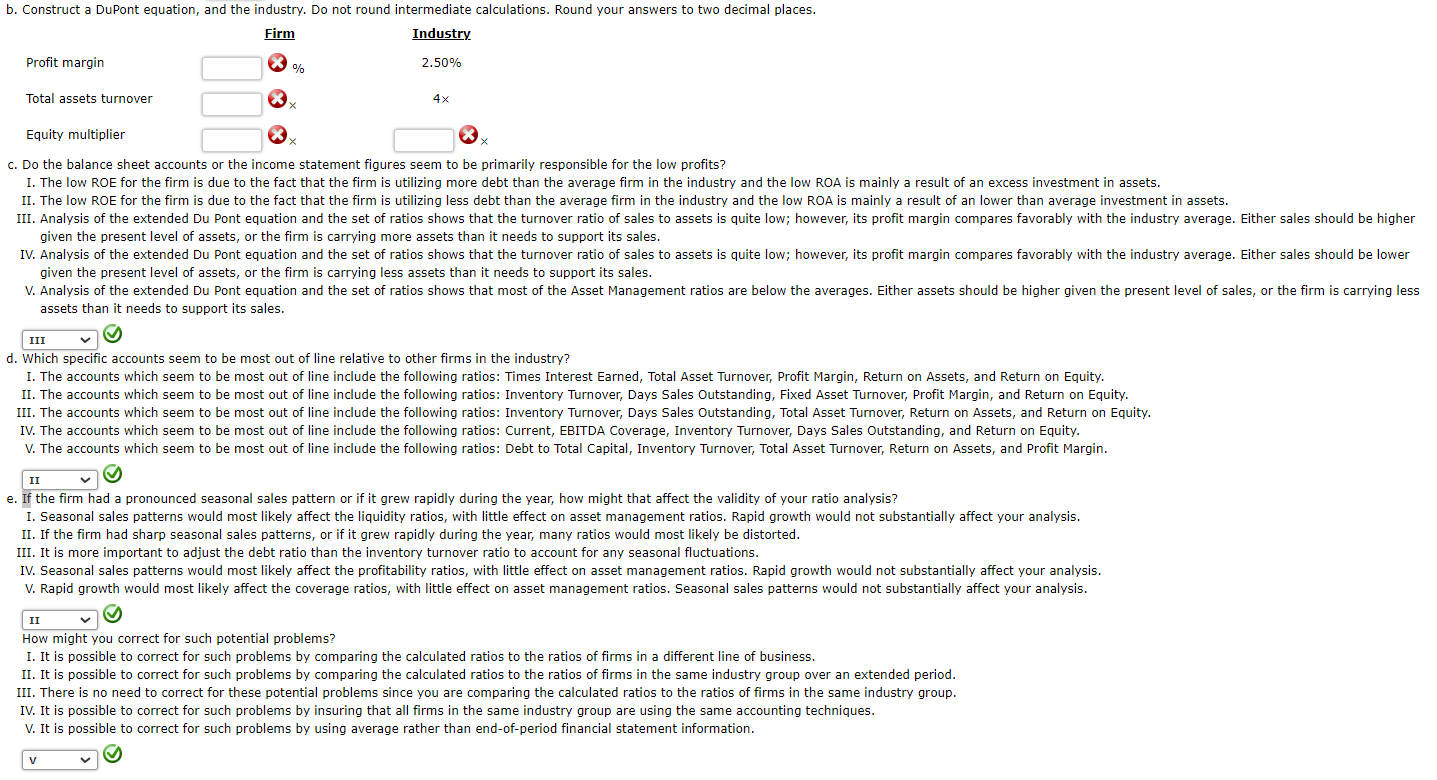 Balance Sheet as of December 31, 2021 (millions of dollars) Income Statement for Year Ended December 31, 2021 (millions of dollars) Net sales Cost of goods sold Gross profit Selling expenses EBITDA Depreciation expense Earnings before interest and taxes (EBIT) Interest expense Earnings before taxes (EBT) Taxes (25\%) Net income $795.00 $115.00680.00 $51.5063.50 $41.5010.00 $36.005.50 $9.0027.00 a. Calculate the following ratios. Do not round intermediate calculations. Round your answers to two decimal places. Current ratio Debt to total capital Times interest earned EBITDA coverage Inventory turnover Days sales outstanding Fixed assets turnover Total assets turnover Profit margin Return on total assets Return on common equity Return on invested capital 7.67Zx Industry Average 2 17% 3 6 11 15 days 6 4 2.50% 10.00% 14.70% 14.40% b. Construct a DuPont equation, and the industry. Do not round intermediate calculations. Round your answers to two decimal places. c. Do the balance sheet accounts or the income statement figures seem to be primarily responsible for the low profits? I. The low ROE for the firm is due to the fact that the firm is utilizing more debt than the average firm in the industry and the low ROA is mainly a result of an excess investment in assets. given the present level of assets, or the firm is carrying more assets than it needs to support its sales. given the present level of assets, or the firm is carrying less assets than it needs to support its sales. assets than it needs to support its sales. d. Which specific accounts seem to be most out of line relative to other firms in the industry? I. The accounts which seem to be most out of line include the following ratios: Times Interest Earned, Total Asset Turnover, Profit Margin, Return on Assets, and Return on Equity. II. The accounts which seem to be most out of line include the following ratios: Inventory Turnover, Days Sales Outstanding, Fixed Asset Turnover, Profit Margin, and Return on Equity. III. The accounts which seem to be most out of line include the following ratios: Inventory Turnover, Days Sales Outstanding, Total Asset Turnover, Return on Assets, and Return on Equity. IV. The accounts which seem to be most out of line include the following ratios: Current, EBITDA Coverage, Inventory Turnover, Days Sales Outstanding, and Return on Equity. V. The accounts which seem to be most out of line include the following ratios: Debt to Total Capital, Inventory Turnover, Total Asset Turnover, Return on Assets, and Profit Margin. e. If the firm had a pronounced seasonal sales pattern or if it grew rapidly during the year, how might that affect the validity of your ratio analysis? I. Seasonal sales patterns would most likely affect the liquidity ratios, with little effect on asset management ratios. Rapid growth would not substantially affect your analysis. II. If the firm had sharp seasonal sales patterns, or if it grew rapidly during the year, many ratios would most likely be distorted. III. It is more important to adjust the debt ratio than the inventory turnover ratio to account for any seasonal fluctuations. IV. Seasonal sales patterns would most likely affect the profitability ratios, with little effect on asset management ratios. Rapid growth would not substantially affect your analysis. V. Rapid growth would most likely affect the coverage ratios, with little effect on asset management ratios. Seasonal sales patterns would not substantially affect your analysis. How might you correct for such potential problems? I. It is possible to correct for such problems by comparing the calculated ratios to the ratios of firms in a different line of business. II. It is possible to correct for such problems by comparing the calculated ratios to the ratios of firms in the same industry group over an extended period. III. There is no need to correct for these potential problems since you are comparing the calculated ratios to the ratios of firms in the same industry group. IV. It is possible to correct for such problems by insuring that all firms in the same industry group are using the same accounting techniques. V. It is possible to correct for such problems by using average rather than end-of-period financial statement information
 Step by Step Solution
There are 3 Steps involved in it
Step: 1

Get Instant Access to Expert-Tailored Solutions
See step-by-step solutions with expert insights and AI powered tools for academic success
Step: 2

Step: 3
Ace Your Homework with AI
Get the answers you need in no time with our AI-driven, step-by-step assistance
Get Started
Crypto Asset Investing In The Age Of Autonomy
Authors: Jake Ryan
1st Edition
1119705363, 978-1119705369