Answered step by step
Verified Expert Solution
Question
1 Approved Answer
Balance Sheet Current Assets 2018 2017 $11,197.00 $10,000.00 $31,000.00 $30,000.00 $42,197.00 $40,000.00 Net PPE Total Assets Current Liabilities Long-term debt Total Liabilities Shareholder Equity Liabilities
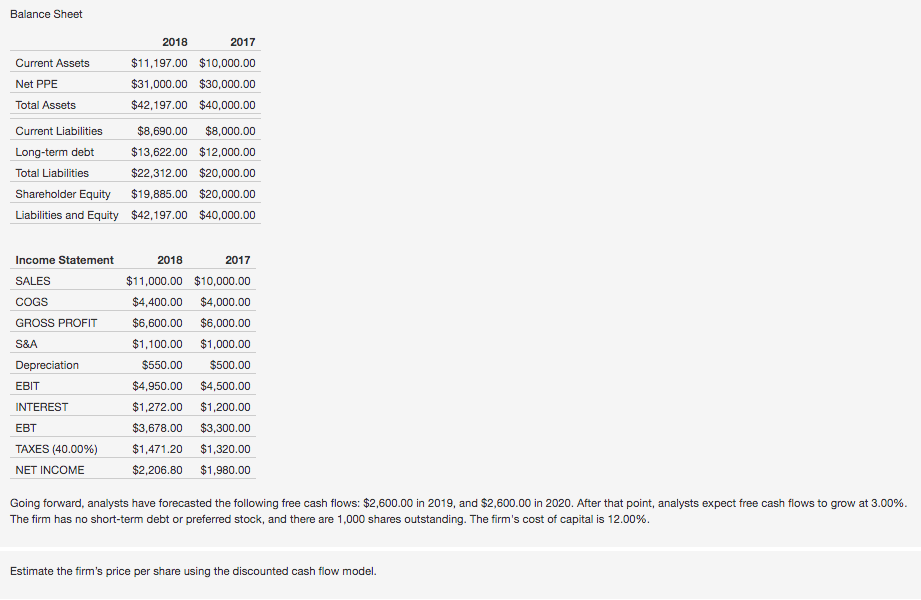
Balance Sheet Current Assets 2018 2017 $11,197.00 $10,000.00 $31,000.00 $30,000.00 $42,197.00 $40,000.00 Net PPE Total Assets Current Liabilities Long-term debt Total Liabilities Shareholder Equity Liabilities and Equity $8,690.00 $8,000.00 $13,622.00 $12,000.00 $22,312.00 $20,000.00 $19,885.00 $20,000.00 $42,197.00 $40,000.00 Income Statement SALES COGS GROSS PROFIT S&A Depreciation 2018 2017 $11,000.00 $10,000.00 $4,400.00 $4,000.00 $6,600.00 $6,000.00 $1,100.00 $1,000.00 $550.00 $500.00 $4,950.00 $4,500.00 $1,272.00 $1,200.00 $3,678.00 $3,300.00 $1,471.20 $1,320.00 $2,206.80 $1,980.00 EBIT INTEREST EBT TAXES (40.00%) NET INCOME Going forward, analysts have forecasted the following free cash flows: $2,600.00 in 2019, and $2,600.00 in 2020. After that point, analysts expect free cash flows to grow at 3.00%. The firm has no short-term debt or preferred stock, and there are 1,000 shares outstanding. The firm's cost of capital is 12.00%. Estimate the firm's price per share using the discounted cash flow model. Balance Sheet Current Assets 2018 2017 $11,197.00 $10,000.00 $31,000.00 $30,000.00 $42,197.00 $40,000.00 Net PPE Total Assets Current Liabilities Long-term debt Total Liabilities Shareholder Equity Liabilities and Equity $8,690.00 $8,000.00 $13,622.00 $12,000.00 $22,312.00 $20,000.00 $19,885.00 $20,000.00 $42,197.00 $40,000.00 Income Statement SALES COGS GROSS PROFIT S&A Depreciation 2018 2017 $11,000.00 $10,000.00 $4,400.00 $4,000.00 $6,600.00 $6,000.00 $1,100.00 $1,000.00 $550.00 $500.00 $4,950.00 $4,500.00 $1,272.00 $1,200.00 $3,678.00 $3,300.00 $1,471.20 $1,320.00 $2,206.80 $1,980.00 EBIT INTEREST EBT TAXES (40.00%) NET INCOME Going forward, analysts have forecasted the following free cash flows: $2,600.00 in 2019, and $2,600.00 in 2020. After that point, analysts expect free cash flows to grow at 3.00%. The firm has no short-term debt or preferred stock, and there are 1,000 shares outstanding. The firm's cost of capital is 12.00%. Estimate the firm's price per share using the discounted cash flow model
Step by Step Solution
There are 3 Steps involved in it
Step: 1
Get Instant Access to Expert-Tailored Solutions
See step-by-step solutions with expert insights and AI powered tools for academic success
Step: 2
Step: 3
Ace Your Homework with AI
Get the answers you need in no time with our AI-driven, step-by-step assistance
Get Started