

Answered step by step
Verified Expert Solution
Question
1 Approved Answer
Balance Sheet: Income Statement: If you could show how to do this, That would be great! Uploaded file Company Analysis Problem Points - 30 Uploaded
 Balance Sheet:
 Income Statement:
If you could show how to do this, That would be great!
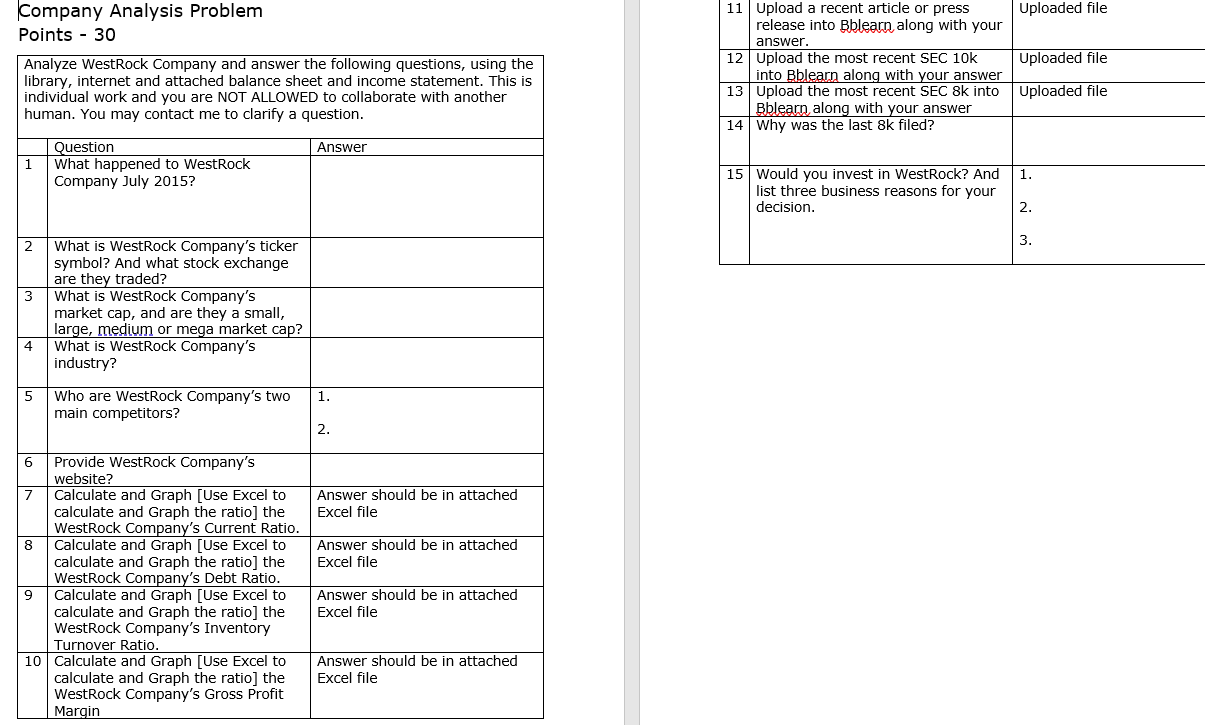
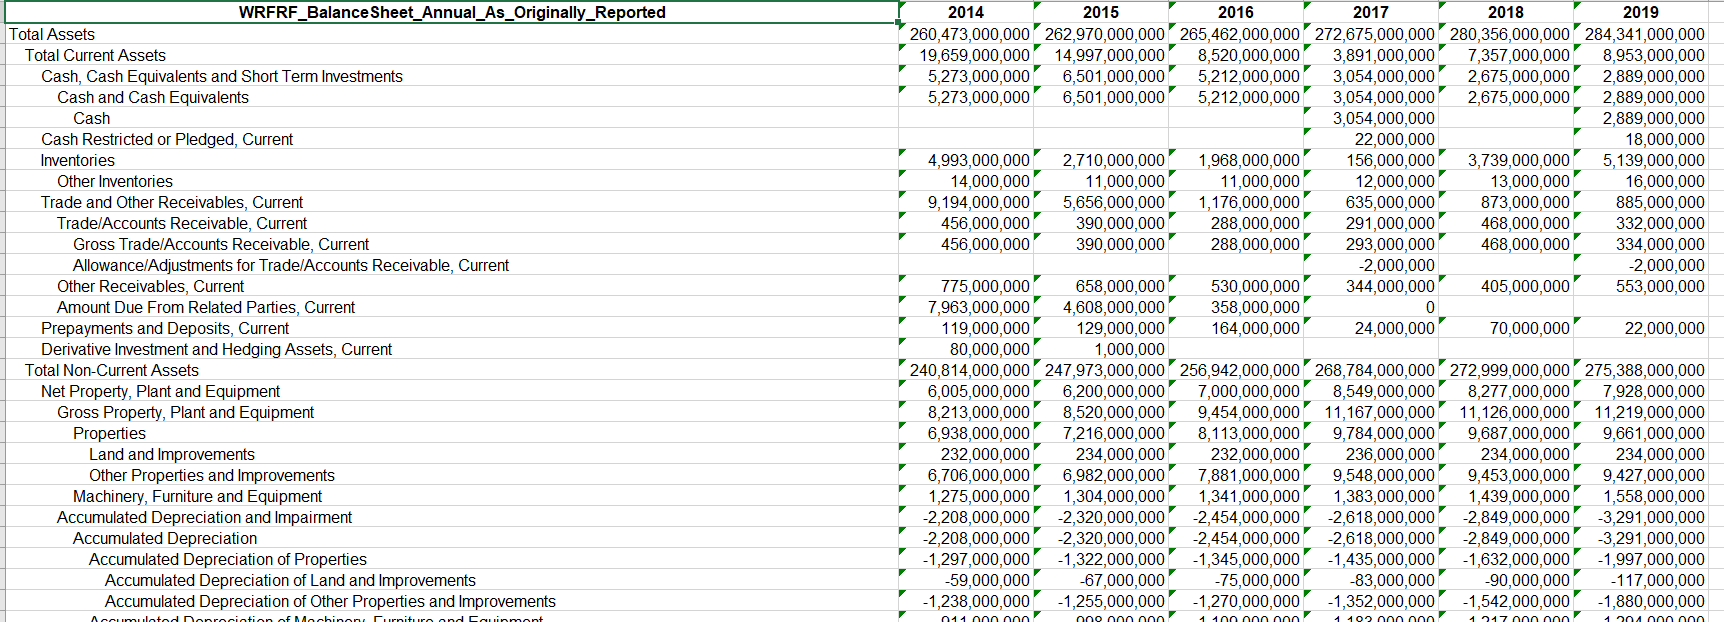
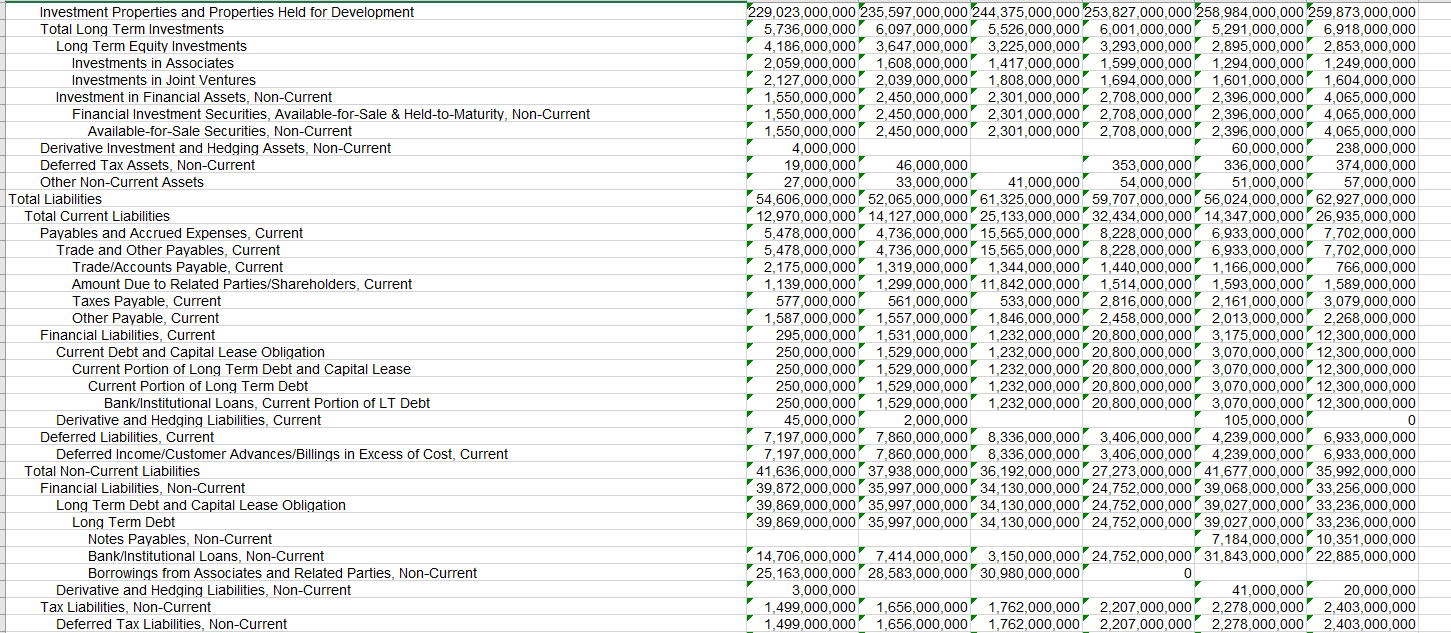
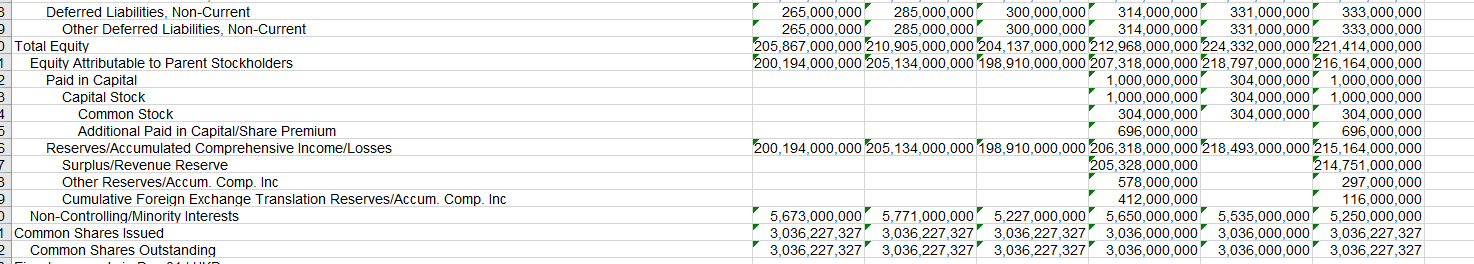
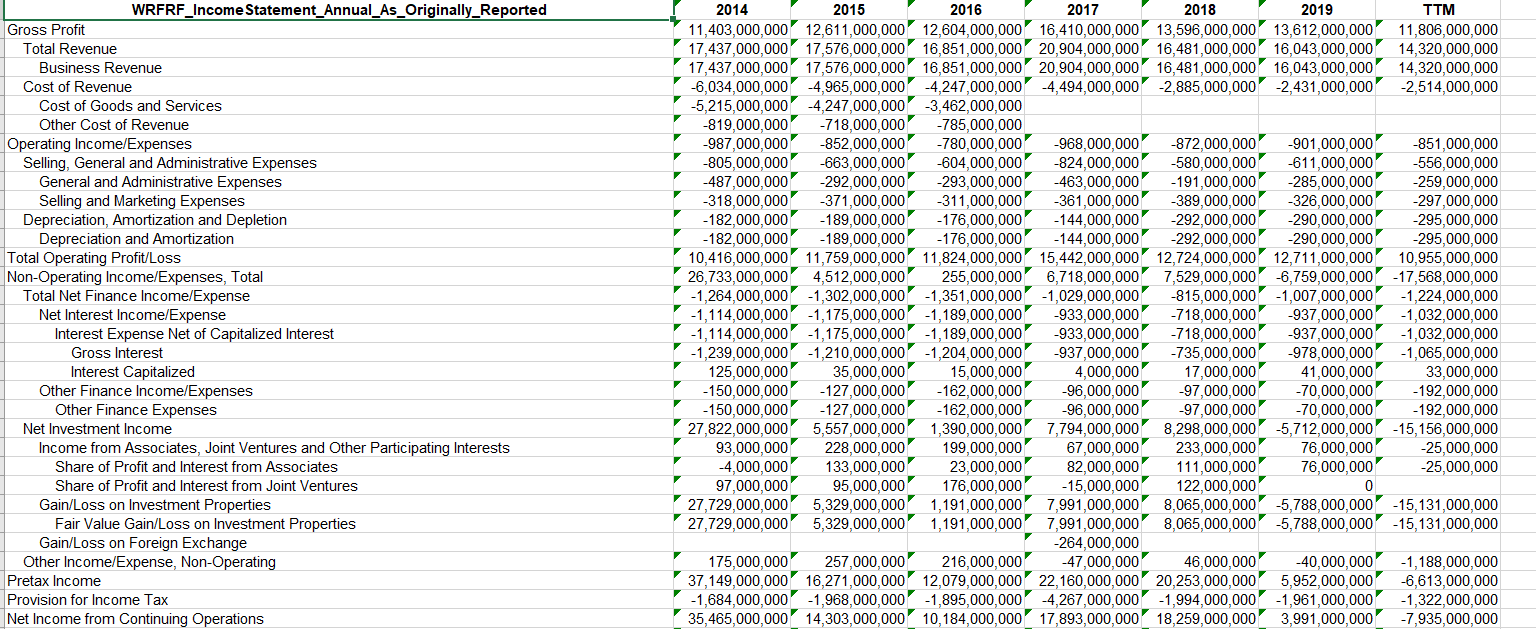
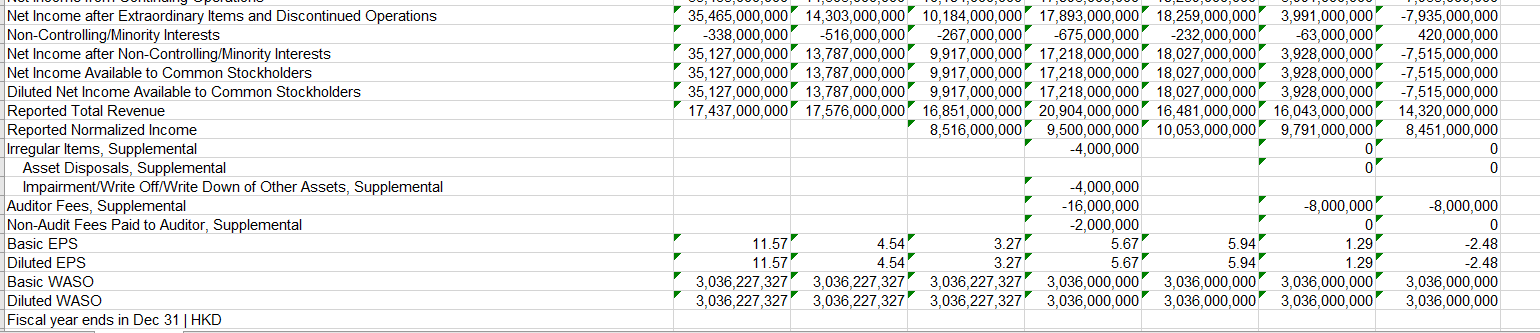
Uploaded file Company Analysis Problem Points - 30 Uploaded file Analyze WestRock Company and answer the following questions, using the library, internet and attached balance sheet and income statement. This is individual work and you are NOT ALLOWED to collaborate with another human. You may contact me to clarify a question. 11 Upload a recent article or press release into Bblearn along with your answer. 12 Upload the most recent SEC 10k into Bblearn along with your answer 13 Upload the most recent SEC 8k into Bblearn along with your answer 14 Why was the last 8k filed? Uploaded file Answer 1 Question What happened to WestRock Company July 2015? 1 15 Would you invest in WestRock? And list three business reasons for your decision. 2. 2 3. 3 What is WestRock Company's ticker symbol? And what stock exchange are they traded? What is WestRock Company's market cap, and are they a small, large, medium or mega market cap? What is WestRock Company's industry? 4 5 1. Who are WestRock Company's two main competitors? 2. Answer should be in attached Excel file Answer should be in attached Excel file 6 Pro WestRock Company's website? 7 Calculate and Graph [Use Excel to calculate and Graph the ratio) the WestRock Company's Current Ratio. 8 Calculate and Graph (Use Excel to calculate and Graph the ratio) the WestRock Company's Debt Ratio. 9 Calculate and Graph (Use Excel to calculate and Graph the ratio) the WestRock Company's Inventory Turnover Ratio. 10 Calculate and Graph [Use Excel to calculate and Graph the ratio) the WestRock Company's Gross Profit Margin Answer should be in attached Excel file Answer should be in attached Excel file WRFRF_Balance Sheet_Annual_As_Originally_Reported Total Assets Total Current Assets Cash, Cash Equivalents and Short Term Investments Cash and Cash Equivalents Cash Cash Restricted or Pledged, Current Inventories Other Inventories Trade and Other Receivables, Current Trade/Accounts Receivable, Current Gross Trade/Accounts Receivable, Current Allowance/Adjustments for Trade/Accounts Receivable, Current Other Receivables, Current Amount Due From Related Parties, Current Prepayments and Deposits, Current Derivative Investment and Hedging Assets, Current Total Non-Current Assets Net Property, Plant and Equipment Gross Property, Plant and Equipment Properties Land and Improvements Other Properties and Improvements Machinery, Furniture and Equipment Accumulated Depreciation and Impairment Accumulated Depreciation Accumulated Depreciation of Properties Accumulated Depreciation of Land and Improvements Accumulated Depreciation of Other Properties and Improvements 2014 2015 2016 2017 2018 2019 260,473,000,000 262,970,000,000 265,462,000,000 272,675,000,000 280,356,000,000 284,341,000,000 19,659,000,000 14,997,000,000 8,520,000,000 3,891,000,000 7,357,000,000 8,953,000,000 5,273,000,000 6,501,000,000 5,212,000,000 3,054,000,000 2,675,000,000 2,889,000,000 5,273,000,000 6,501,000,000 5,212,000,000 3,054,000,000 2,675,000,000 2,889,000,000 3,054,000,000 2,889,000,000 22,000,000 18,000,000 4,993,000,000 2,710,000,000 1,968,000,000 156,000,000 3,739,000,000 5,139,000,000 14,000,000 11,000,000 11,000,000 12,000,000 13,000,000 16,000,000 9,194,000,000 5,656,000,000 1,176,000,000 635,000,000 873,000,000 885,000,000 456,000,000 390,000,000 288,000,000 291,000,000 468,000,000 332,000,000 456,000,000 390,000,000 288,000,000 293,000,000 468,000,000 334,000,000 -2,000,000 -2,000,000 775,000,000 658,000,000 530,000,000 344,000,000 405,000,000 553,000,000 7,963,000,000 4,608,000,000 358,000,000 0 119,000,000 129,000,000 164,000,000 24,000,000 70,000,000 22,000,000 80,000,000 1,000,000 240,814,000,000 247,973,000,000 256,942,000,000 268,784,000,000 272,999,000,000 275,388,000,000 6,005,000,000 6,200,000,000 7,000,000,000 8,549,000,000 8,277,000,000 7,928,000,000 8,213,000,000 8,520,000,000 9,454,000,000 11,167,000,000 11,126,000,000 11,219,000,000 6,938,000,000 7,216,000,000 8,113,000,000 9,784,000,000 9,687,000,000 9,661,000,000 232,000,000 234,000,000 232,000,000 236,000,000 234,000,000 234,000,000 6,706,000,000 6,982,000,000 7,881,000,000 9,548,000,000 9,453,000,000 9,427,000,000 1,275,000,000 1,304,000,000 1,341,000,000 1,383,000,000 1,439,000,000 1,558,000,000 -2,208,000,000 -2,320,000,000 -2,454,000,000 -2,618,000,000 -2,849,000,000 -3,291,000,000 -2,208,000,000 -2,320,000,000 -2,454,000,000 -2,618,000,000 -2,849,000,000 -3,291,000,000 -1,297,000,000 -1,322,000,000 -1,345,000,000 -1,435,000,000 -1,632,000,000 -1,997,000,000 -59,000,000 -67,000,000 -75,000,000 -83,000,000 -90,000,000 -117,000,000 -1,238,000,000 -1,255,000,000 - 1,270,000,000 -1,352,000,000 -1,542,000,000 -1,880,000,000 1 100 non non 1 1970nn non Acumuotod onrociation of Moabinon urniture and Caumont 011000000 nno nonno 1 2170 1 20400 000 Investment Properties and Properties Held for Development Total Long Term Investments Long Term Equity Investments Investments in Associates Investments in Joint Ventures Investment in Financial Assets, Non-Current Financial Investment Securities, Available-for-Sale & Held-to-Maturity, Non-Current Available-for-Sale Securities, Non-Current Derivative Investment and Hedging Assets, Non-Current Deferred Tax Assets, Non-Current Other Non-Current Assets Total Liabilities Total Current Liabilities Payables and Accrued Expenses, Current Trade and Other Payables, Current Trade/Accounts Payable, Current Amount Due to Related Parties/Shareholders, Current Taxes Payable, Current Other Payable, Current Financial Liabilities, Current Current Debt and Capital Lease Obligation Current Portion of Long Term Debt and Capital Lease Current Portion of Long Term Debt Bank/Institutional Loans, Current Portion of LT Debt Derivative and Hedging Liabilities, Current Deferred Liabilities, Current Deferred Income/Customer Advances/Billings in Excess of Cost, Current Total Non-Current Liabilities Financial Liabilities, Non-Current Long Term Debt and Capital Lease Obligation Long Term Debt Notes Payables, Non-Current Bank/Institutional Loans, Non-Current Borrowings from Associates and Related Parties, Non-Current Derivative and Hedging Liabilities, Non-Current Tax Liabilities, Non-Current Deferred Tax Liabilities, Non-Current 229,023,000,000 235,597,000,000 244,375,000,000 253,827,000,000 258,984,000,000 259,873,000,000 5,736,000,000 6,097,000,000 5,526,000,000 6,001,000,000 5,291,000,000 6,918,000,000 4,186,000,000 3,647,000,000 3,225,000,000 3,293,000,000 2,895,000,000 2,853,000,000 2,059,000,000 1,608,000,000 1,417,000,000 1,599,000,000 1,294,000,000 1,249,000,000 2,127,000,000 2,039,000,000 1,808,000,000 1,694,000,000 1,601,000,000 1,604,000,000 1,550,000,000 2,450,000,000 2,301,000,000 2,708,000,000 2,396,000,000 4,065,000,000 1,550,000,000 2,450,000,000 2,301,000,000 2,708,000,000 2,396,000,000 4,065,000,000 1,550,000,000 2,450,000,000 2,301,000,000 2,708,000,000 2,396,000,000 4,065,000,000 4,000,000 60,000,000 238,000,000 19,000,000 46,000,000 353.000.000 336,000,000 374,000,000 27,000,000 33,000,000 41,000,000 54,000,000 51,000,000 57,000,000 54,606,000,000 52,065,000,000 61,325,000,000 59,707,000,000 56,024,000,000 62,927,000,000 12,970,000,000 14,127,000,000 25,133,000,000 32,434,000,000 14,347,000,000 26,935,000,000 5,478,000,000 4,736,000,000 15,565,000,000 8,228,000,000' 6,933,000,000 7,702,000,000 5,478,000,000 4,736,000,000 15,565,000,000 8,228,000,000' 6,933,000,000 7,702,000,000 2,175,000,000 1,319,000,000 1,344,000,000 1,440,000,000 1,166,000,000 766,000,000 1,139,000,000 1,299,000,000 11,842,000,000 1,514,000,000 1,593,000,000 1,589,000,000 577,000,000 561,000,000 533,000,000 2,816,000,000 2,161,000,000 3,079,000,000 1,587,000,000 1,557,000,000 1,846,000,000 2,458,000,000 2,013,000,000 2,268,000,000 295,000,000 1,531,000,000 1,232,000,000 20,800,000,000 3,175,000,000 12,300,000,000 250,000,000 1,529,000,000 1,232,000,000 20,800,000,000 3,070,000,000 12,300,000,000 250.000.000 1,529,000,000 1,232,000,000 20,800,000,000 3,070,000,000 12,300,000,000 250,000,000 1,529,000,000 1.232.000.000 20.800,000,000 3,070,000,000 12,300,000,000 250,000,000 1,529,000,000 1,232,000,000 20,800,000,000 3,070,000,000 12,300,000,000 45,000,000 2,000,000 105,000,000 0 7,197,000,000 7,860,000,000 8,336,000,000 3,406,000,000 4,239,000,000 6,933,000,000 7,197,000,000 7,860,000,000 8,336,000,000 3,406,000,000 4,239,000,000 6,933,000,000 41,636,000,000 37,938,000,000 36,192,000,000 27,273,000,000 41,677,000,000 35,992,000,000 39,872,000,000 35,997,000,000 34,130,000,000 24,752,000,000 39,068,000,000 33,256,000,000 39,869,000,000 35,997,000,000 34,130,000,000 24,752,000,000 39,027,000,000 33,236,000,000 39,869,000,000 35,997,000,000 34,130,000,000 24,752,000,000 39,027,000,000 33,236,000,000 7,184,000,000 10,351,000,000 14,706,000,000 7,414,000,000 3,150,000,000 24,752,000,000 31,843,000,000 22,885,000,000 25,163,000,000 28,583,000,000 30,980,000,000 0 3,000,000 41,000,000 20,000,000 1,499,000,000 1,656,000,000 1,762,000,000 2,207,000,000 2,278,000,000 2,403,000,000 1,499,000,000 1,656,000,000 1,762,000,000 2,207,000,000 2,278,000,000 2,403,000,000 3 Deferred Liabilities, Non-Current Other Deferred Liabilities, Non-Current Total Equity Equity Attributable to Parent Stockholders Paid in Capital Capital Stock 4 Common Stock Additional Paid in Capital/Share Premium Reserves/Accumulated Comprehensive Income/Losses Surplus/Revenue Reserve Other Reserves/Accum. Comp. Inc Cumulative Foreign Exchange Translation Reserves/Accum. Comp. Inc Non-Controlling/Minority Interests Common Shares Issued Common Shares Outstanding 265,000,000 285,000,000 300,000,000 314,000,000 331,000,000 333,000,000 265,000,000 285,000,000 300,000,000 314,000,000 331,000,000 333,000,000 205,867,000,000 210,905,000,000 204,137,000,000 212,968,000,000 224,332,000,000 221,414,000,000 200,194,000,000 205,134,000,000 198,910,000,000 207,318,000,000 218,797,000,000 216,164,000,000 1,000,000,000 304,000,000 1,000,000,000 1,000,000,000 304,000,000 1,000,000,000 304,000,000 304,000,000 304,000,000 696,000,000 696,000,000 200,194,000,000 205,134,000,000 198,910,000,000 206,318,000,000 218,493,000,000 215,164,000,000 205,328,000,000 214.751,000,000 578,000,000 297,000,000 412,000,000 116,000,000 5,673,000,000' 5,771,000,000' 5,227,000,000' 5,650,000,000' 5,535,000,000' 5,250,000,000 3,036,227,327' 3,036,227,327' 3,036,227,327' 3,036,000,000 3,036,000,000 3,036,227,327 3,036,227,327' 3,036,227,327' 3,036,227,327' 3,036,000,000 3,036,000,000 3,036,227,327 WRFRF_Income Statement_Annual_As_Originally_Reported Gross Profit Total Revenue Business Revenue Cost of Revenue Cost of Goods and Services Other Cost of Revenue Operating Income/Expenses Selling, General and Administrative Expenses General and Administrative Expenses Selling and Marketing Expenses Depreciation, Amortization and Depletion Depreciation and Amortization Total Operating Profit/Loss Non-Operating Income/Expenses, Total Total Net Finance Income/Expense Net Interest Income/Expense Interest Expense Net of Capitalized Interest Gross Interest Interest Capitalized Other Finance Income/Expenses Other Finance Expenses Net Investment Income Income from Associates, Joint Ventures and Other Participating Interests Share of Profit and Interest from Associates Share of Profit and Interest from Joint Ventures Gain/Loss on Investment Properties Fair Value Gain/Loss on Investment Properties Gain/Loss on Foreign Exchange Other Income/Expense, Non-Operating Pretax Income Provision for Income Tax Net Income from Continuing Operations 2014 2015 2016 2017 2018 2019 TTM 11,403,000,000 12,611,000,000 12,604,000,000 16,410,000,000 13,596,000,000 13,612,000,000 11,806,000,000 17,437,000,000 17,576,000,000 16,851,000,000 20,904,000,000 16,481,000,000 16,043,000,000 14,320,000,000 17,437,000,000 17,576,000,000'16,851,000,000 20,904,000,000 16,481,000,000 16,043,000,000 14,320,000,000 -6,034,000,000 -4,965,000,000 -4,247,000,000 -4,494,000,000 -2,885,000,000 -2,431,000,000 -2,514,000,000 -5,215,000,000 -4,247,000,000 3,462,000,000 -819,000,000 -718,000,000 -785,000,000 -987,000,000 -852,000,000 -780,000,000 -968,000,000 -872,000,000 -901,000,000 -851,000,000 -805,000,000 -663,000,000 -604,000,000 -824.000.000 -580,000,000 -611,000,000 -556,000,000 -487,000,000 -292,000,000 -293.000.000 -463,000,000 -191,000,000 -285,000,000 -259,000,000 -318,000,000 -371,000,000 -311,000,000 -361,000,000 -389,000,000 -326,000,000 -297,000,000 -182,000,000 -189,000,000 -176,000,000 -144,000,000 -292,000,000 -290,000,000 -295,000,000 -182,000,000 -189,000,000 -176,000,000 -144,000,000 -292,000,000 -290,000,000 -295,000,000 10,416,000,000 11,759,000,000 11,824,000,000 15,442,000,000 12,724,000,000 12,711,000,000 10,955,000,000 26,733,000,000' 4,512,000,000 255,000,000 6,718,000,000 7,529,000,000 -6,759,000,000 -17,568,000,000 -1,264,000,000 -1,302,000,000 -1,351,000,000 -1,029,000,000 -815,000,000 -1,007,000,000 -1,224,000,000 -1,114,000,000 -1,175,000,000 -1,189,000,000 -933,000,000 -718,000,000 -937,000,000 -1,032,000,000 -1,114,000,000 -1,175,000,000 -1,189,000,000 -933,000,000 -718,000,000 -937,000,000 -1,032,000,000 -1,239,000,000 -1,210,000,000 -1,204,000,000 -937,000,000 -735,000,000 -978,000,000 -1,065,000,000 125,000,000 35,000,000 15,000,000 4,000,000 17,000,000 41,000,000 33,000,000 -150.000.000 - 127,000,000 -162,000,000 -96.000.000 -97,000,000 -70,000,000 -192,000,000 -150,000,000 -127,000,000 -162,000,000 -96,000,000 -97,000,000 -70,000,000 -192,000,000 27,822,000,000 5,557,000,000 1,390,000,000 7,794,000,000 8,298,000,000 -5,712,000,000 -15,156,000,000 93,000,000 228,000,000 199,000,000 67,000,000 233,000,000 76,000,000 -25,000,000 -4,000,000 133,000,000 23,000,000 82,000,000 111,000,000 76,000,000 -25,000,000 97,000,000 95,000,000 176,000,000 -15,000,000 122,000,000 0 27,729,000,000 5,329,000,000 1,191,000,000 7,991,000,000 8,065,000,000 -5,788,000,000 -15,131,000,000 27,729,000,000 5,329,000,000 1,191,000,000 7,991,000,000 8,065,000,000 -5,788,000,000 -15,131,000,000 -264,000,000 175,000,000 257,000,000 216,000,000 -47,000,000 46,000,000 -40,000,000 -1,188,000,000 37,149,000,000 16,271,000,000 12,079,000,000 22,160,000,000 20,253,000,000' 5,952,000,000 -6,613,000,000 -1,684,000,000 -1,968,000,000 -1,895,000,000 -4,267,000,000 -1,994,000,000 -1,961,000,000 -1,322,000,000 35,465,000,000 14,303,000,000 10,184,000,000 17,893,000,000 18,259,000,000 3,991,000,000 -7,935,000,000 07 Net Income after Extraordinary Items and Discontinued Operations Non-Controlling/Minority Interests Net Income after Non-Controlling/Minority Interests Net Income Available to Common Stockholders Diluted Net Income Available to Common Stockholders Reported Total Revenue Reported Normalized Income Irregular Items, Supplemental Asset Disposals, Supplemental Impairment/Write Off/Write Down of Other Assets, Supplemental Auditor Fees, Supplemental Non-Audit Fees Paid to Auditor, Supplemental Basic EPS Diluted EPS Basic WASO Diluted WASO Fiscal year ends in Dec 31 HKD 35,465,000,000 14,303,000,000 10,184,000,000 17,893,000,000 18,259,000,000 3,991,000,000 -7,935,000,000 -338.000.000 -516,000,000 -267,000,000 -675,000,000 -232,000,000 35,127,000,000 13,787,000,000 -63,000,000 420,000,000 9,917,000,000 17,218,000,000 18,027,000,000 3,928,000,000 -7,515,000,000 35,127,000,000 13,787,000,000' 9,917,000,000 17,218,000,000 18,027,000,000 3,928,000,000 -7,515,000,000 35,127,000,000 13,787,000,000 9,917,000,000 17,218,000,000 18,027,000,000 3,928,000,000 -7,515,000,000 17,437,000,000 17,576,000,000 16,851,000,000 20,904,000,000 16,481,000,000 16,043,000,000 14,320,000,000 8,516,000,000 9,500,000,000 10,053,000,000' 9,791,000,000 8,451,000,000 -4,000,000 0 07 0 -4,000,000 -16,000,000 -8,000,000 -8,000,000 -2,000,000 07 11.57 4.54 3.27 5.67 5.94 1.29 -2.48 11.57 4.547 3.271 5.67 5.94 1.29 -2.48 3,036,227,327' 3,036,227,327' 3,036,227,327' 3,036,000,000 3,036,000,000 3,036,000,000 3,036,227,327' 3,036,227,327' 3,036,227,327' 3,036,000,000 3,036,000,000 3,036,000,000 3,036,000,000 3,036,000,000 0 Uploaded file Company Analysis Problem Points - 30 Uploaded file Analyze WestRock Company and answer the following questions, using the library, internet and attached balance sheet and income statement. This is individual work and you are NOT ALLOWED to collaborate with another human. You may contact me to clarify a question. 11 Upload a recent article or press release into Bblearn along with your answer. 12 Upload the most recent SEC 10k into Bblearn along with your answer 13 Upload the most recent SEC 8k into Bblearn along with your answer 14 Why was the last 8k filed? Uploaded file Answer 1 Question What happened to WestRock Company July 2015? 1 15 Would you invest in WestRock? And list three business reasons for your decision. 2. 2 3. 3 What is WestRock Company's ticker symbol? And what stock exchange are they traded? What is WestRock Company's market cap, and are they a small, large, medium or mega market cap? What is WestRock Company's industry? 4 5 1. Who are WestRock Company's two main competitors? 2. Answer should be in attached Excel file Answer should be in attached Excel file 6 Pro WestRock Company's website? 7 Calculate and Graph [Use Excel to calculate and Graph the ratio) the WestRock Company's Current Ratio. 8 Calculate and Graph (Use Excel to calculate and Graph the ratio) the WestRock Company's Debt Ratio. 9 Calculate and Graph (Use Excel to calculate and Graph the ratio) the WestRock Company's Inventory Turnover Ratio. 10 Calculate and Graph [Use Excel to calculate and Graph the ratio) the WestRock Company's Gross Profit Margin Answer should be in attached Excel file Answer should be in attached Excel file WRFRF_Balance Sheet_Annual_As_Originally_Reported Total Assets Total Current Assets Cash, Cash Equivalents and Short Term Investments Cash and Cash Equivalents Cash Cash Restricted or Pledged, Current Inventories Other Inventories Trade and Other Receivables, Current Trade/Accounts Receivable, Current Gross Trade/Accounts Receivable, Current Allowance/Adjustments for Trade/Accounts Receivable, Current Other Receivables, Current Amount Due From Related Parties, Current Prepayments and Deposits, Current Derivative Investment and Hedging Assets, Current Total Non-Current Assets Net Property, Plant and Equipment Gross Property, Plant and Equipment Properties Land and Improvements Other Properties and Improvements Machinery, Furniture and Equipment Accumulated Depreciation and Impairment Accumulated Depreciation Accumulated Depreciation of Properties Accumulated Depreciation of Land and Improvements Accumulated Depreciation of Other Properties and Improvements 2014 2015 2016 2017 2018 2019 260,473,000,000 262,970,000,000 265,462,000,000 272,675,000,000 280,356,000,000 284,341,000,000 19,659,000,000 14,997,000,000 8,520,000,000 3,891,000,000 7,357,000,000 8,953,000,000 5,273,000,000 6,501,000,000 5,212,000,000 3,054,000,000 2,675,000,000 2,889,000,000 5,273,000,000 6,501,000,000 5,212,000,000 3,054,000,000 2,675,000,000 2,889,000,000 3,054,000,000 2,889,000,000 22,000,000 18,000,000 4,993,000,000 2,710,000,000 1,968,000,000 156,000,000 3,739,000,000 5,139,000,000 14,000,000 11,000,000 11,000,000 12,000,000 13,000,000 16,000,000 9,194,000,000 5,656,000,000 1,176,000,000 635,000,000 873,000,000 885,000,000 456,000,000 390,000,000 288,000,000 291,000,000 468,000,000 332,000,000 456,000,000 390,000,000 288,000,000 293,000,000 468,000,000 334,000,000 -2,000,000 -2,000,000 775,000,000 658,000,000 530,000,000 344,000,000 405,000,000 553,000,000 7,963,000,000 4,608,000,000 358,000,000 0 119,000,000 129,000,000 164,000,000 24,000,000 70,000,000 22,000,000 80,000,000 1,000,000 240,814,000,000 247,973,000,000 256,942,000,000 268,784,000,000 272,999,000,000 275,388,000,000 6,005,000,000 6,200,000,000 7,000,000,000 8,549,000,000 8,277,000,000 7,928,000,000 8,213,000,000 8,520,000,000 9,454,000,000 11,167,000,000 11,126,000,000 11,219,000,000 6,938,000,000 7,216,000,000 8,113,000,000 9,784,000,000 9,687,000,000 9,661,000,000 232,000,000 234,000,000 232,000,000 236,000,000 234,000,000 234,000,000 6,706,000,000 6,982,000,000 7,881,000,000 9,548,000,000 9,453,000,000 9,427,000,000 1,275,000,000 1,304,000,000 1,341,000,000 1,383,000,000 1,439,000,000 1,558,000,000 -2,208,000,000 -2,320,000,000 -2,454,000,000 -2,618,000,000 -2,849,000,000 -3,291,000,000 -2,208,000,000 -2,320,000,000 -2,454,000,000 -2,618,000,000 -2,849,000,000 -3,291,000,000 -1,297,000,000 -1,322,000,000 -1,345,000,000 -1,435,000,000 -1,632,000,000 -1,997,000,000 -59,000,000 -67,000,000 -75,000,000 -83,000,000 -90,000,000 -117,000,000 -1,238,000,000 -1,255,000,000 - 1,270,000,000 -1,352,000,000 -1,542,000,000 -1,880,000,000 1 100 non non 1 1970nn non Acumuotod onrociation of Moabinon urniture and Caumont 011000000 nno nonno 1 2170 1 20400 000 Investment Properties and Properties Held for Development Total Long Term Investments Long Term Equity Investments Investments in Associates Investments in Joint Ventures Investment in Financial Assets, Non-Current Financial Investment Securities, Available-for-Sale & Held-to-Maturity, Non-Current Available-for-Sale Securities, Non-Current Derivative Investment and Hedging Assets, Non-Current Deferred Tax Assets, Non-Current Other Non-Current Assets Total Liabilities Total Current Liabilities Payables and Accrued Expenses, Current Trade and Other Payables, Current Trade/Accounts Payable, Current Amount Due to Related Parties/Shareholders, Current Taxes Payable, Current Other Payable, Current Financial Liabilities, Current Current Debt and Capital Lease Obligation Current Portion of Long Term Debt and Capital Lease Current Portion of Long Term Debt Bank/Institutional Loans, Current Portion of LT Debt Derivative and Hedging Liabilities, Current Deferred Liabilities, Current Deferred Income/Customer Advances/Billings in Excess of Cost, Current Total Non-Current Liabilities Financial Liabilities, Non-Current Long Term Debt and Capital Lease Obligation Long Term Debt Notes Payables, Non-Current Bank/Institutional Loans, Non-Current Borrowings from Associates and Related Parties, Non-Current Derivative and Hedging Liabilities, Non-Current Tax Liabilities, Non-Current Deferred Tax Liabilities, Non-Current 229,023,000,000 235,597,000,000 244,375,000,000 253,827,000,000 258,984,000,000 259,873,000,000 5,736,000,000 6,097,000,000 5,526,000,000 6,001,000,000 5,291,000,000 6,918,000,000 4,186,000,000 3,647,000,000 3,225,000,000 3,293,000,000 2,895,000,000 2,853,000,000 2,059,000,000 1,608,000,000 1,417,000,000 1,599,000,000 1,294,000,000 1,249,000,000 2,127,000,000 2,039,000,000 1,808,000,000 1,694,000,000 1,601,000,000 1,604,000,000 1,550,000,000 2,450,000,000 2,301,000,000 2,708,000,000 2,396,000,000 4,065,000,000 1,550,000,000 2,450,000,000 2,301,000,000 2,708,000,000 2,396,000,000 4,065,000,000 1,550,000,000 2,450,000,000 2,301,000,000 2,708,000,000 2,396,000,000 4,065,000,000 4,000,000 60,000,000 238,000,000 19,000,000 46,000,000 353.000.000 336,000,000 374,000,000 27,000,000 33,000,000 41,000,000 54,000,000 51,000,000 57,000,000 54,606,000,000 52,065,000,000 61,325,000,000 59,707,000,000 56,024,000,000 62,927,000,000 12,970,000,000 14,127,000,000 25,133,000,000 32,434,000,000 14,347,000,000 26,935,000,000 5,478,000,000 4,736,000,000 15,565,000,000 8,228,000,000' 6,933,000,000 7,702,000,000 5,478,000,000 4,736,000,000 15,565,000,000 8,228,000,000' 6,933,000,000 7,702,000,000 2,175,000,000 1,319,000,000 1,344,000,000 1,440,000,000 1,166,000,000 766,000,000 1,139,000,000 1,299,000,000 11,842,000,000 1,514,000,000 1,593,000,000 1,589,000,000 577,000,000 561,000,000 533,000,000 2,816,000,000 2,161,000,000 3,079,000,000 1,587,000,000 1,557,000,000 1,846,000,000 2,458,000,000 2,013,000,000 2,268,000,000 295,000,000 1,531,000,000 1,232,000,000 20,800,000,000 3,175,000,000 12,300,000,000 250,000,000 1,529,000,000 1,232,000,000 20,800,000,000 3,070,000,000 12,300,000,000 250.000.000 1,529,000,000 1,232,000,000 20,800,000,000 3,070,000,000 12,300,000,000 250,000,000 1,529,000,000 1.232.000.000 20.800,000,000 3,070,000,000 12,300,000,000 250,000,000 1,529,000,000 1,232,000,000 20,800,000,000 3,070,000,000 12,300,000,000 45,000,000 2,000,000 105,000,000 0 7,197,000,000 7,860,000,000 8,336,000,000 3,406,000,000 4,239,000,000 6,933,000,000 7,197,000,000 7,860,000,000 8,336,000,000 3,406,000,000 4,239,000,000 6,933,000,000 41,636,000,000 37,938,000,000 36,192,000,000 27,273,000,000 41,677,000,000 35,992,000,000 39,872,000,000 35,997,000,000 34,130,000,000 24,752,000,000 39,068,000,000 33,256,000,000 39,869,000,000 35,997,000,000 34,130,000,000 24,752,000,000 39,027,000,000 33,236,000,000 39,869,000,000 35,997,000,000 34,130,000,000 24,752,000,000 39,027,000,000 33,236,000,000 7,184,000,000 10,351,000,000 14,706,000,000 7,414,000,000 3,150,000,000 24,752,000,000 31,843,000,000 22,885,000,000 25,163,000,000 28,583,000,000 30,980,000,000 0 3,000,000 41,000,000 20,000,000 1,499,000,000 1,656,000,000 1,762,000,000 2,207,000,000 2,278,000,000 2,403,000,000 1,499,000,000 1,656,000,000 1,762,000,000 2,207,000,000 2,278,000,000 2,403,000,000 3 Deferred Liabilities, Non-Current Other Deferred Liabilities, Non-Current Total Equity Equity Attributable to Parent Stockholders Paid in Capital Capital Stock 4 Common Stock Additional Paid in Capital/Share Premium Reserves/Accumulated Comprehensive Income/Losses Surplus/Revenue Reserve Other Reserves/Accum. Comp. Inc Cumulative Foreign Exchange Translation Reserves/Accum. Comp. Inc Non-Controlling/Minority Interests Common Shares Issued Common Shares Outstanding 265,000,000 285,000,000 300,000,000 314,000,000 331,000,000 333,000,000 265,000,000 285,000,000 300,000,000 314,000,000 331,000,000 333,000,000 205,867,000,000 210,905,000,000 204,137,000,000 212,968,000,000 224,332,000,000 221,414,000,000 200,194,000,000 205,134,000,000 198,910,000,000 207,318,000,000 218,797,000,000 216,164,000,000 1,000,000,000 304,000,000 1,000,000,000 1,000,000,000 304,000,000 1,000,000,000 304,000,000 304,000,000 304,000,000 696,000,000 696,000,000 200,194,000,000 205,134,000,000 198,910,000,000 206,318,000,000 218,493,000,000 215,164,000,000 205,328,000,000 214.751,000,000 578,000,000 297,000,000 412,000,000 116,000,000 5,673,000,000' 5,771,000,000' 5,227,000,000' 5,650,000,000' 5,535,000,000' 5,250,000,000 3,036,227,327' 3,036,227,327' 3,036,227,327' 3,036,000,000 3,036,000,000 3,036,227,327 3,036,227,327' 3,036,227,327' 3,036,227,327' 3,036,000,000 3,036,000,000 3,036,227,327 WRFRF_Income Statement_Annual_As_Originally_Reported Gross Profit Total Revenue Business Revenue Cost of Revenue Cost of Goods and Services Other Cost of Revenue Operating Income/Expenses Selling, General and Administrative Expenses General and Administrative Expenses Selling and Marketing Expenses Depreciation, Amortization and Depletion Depreciation and Amortization Total Operating Profit/Loss Non-Operating Income/Expenses, Total Total Net Finance Income/Expense Net Interest Income/Expense Interest Expense Net of Capitalized Interest Gross Interest Interest Capitalized Other Finance Income/Expenses Other Finance Expenses Net Investment Income Income from Associates, Joint Ventures and Other Participating Interests Share of Profit and Interest from Associates Share of Profit and Interest from Joint Ventures Gain/Loss on Investment Properties Fair Value Gain/Loss on Investment Properties Gain/Loss on Foreign Exchange Other Income/Expense, Non-Operating Pretax Income Provision for Income Tax Net Income from Continuing Operations 2014 2015 2016 2017 2018 2019 TTM 11,403,000,000 12,611,000,000 12,604,000,000 16,410,000,000 13,596,000,000 13,612,000,000 11,806,000,000 17,437,000,000 17,576,000,000 16,851,000,000 20,904,000,000 16,481,000,000 16,043,000,000 14,320,000,000 17,437,000,000 17,576,000,000'16,851,000,000 20,904,000,000 16,481,000,000 16,043,000,000 14,320,000,000 -6,034,000,000 -4,965,000,000 -4,247,000,000 -4,494,000,000 -2,885,000,000 -2,431,000,000 -2,514,000,000 -5,215,000,000 -4,247,000,000 3,462,000,000 -819,000,000 -718,000,000 -785,000,000 -987,000,000 -852,000,000 -780,000,000 -968,000,000 -872,000,000 -901,000,000 -851,000,000 -805,000,000 -663,000,000 -604,000,000 -824.000.000 -580,000,000 -611,000,000 -556,000,000 -487,000,000 -292,000,000 -293.000.000 -463,000,000 -191,000,000 -285,000,000 -259,000,000 -318,000,000 -371,000,000 -311,000,000 -361,000,000 -389,000,000 -326,000,000 -297,000,000 -182,000,000 -189,000,000 -176,000,000 -144,000,000 -292,000,000 -290,000,000 -295,000,000 -182,000,000 -189,000,000 -176,000,000 -144,000,000 -292,000,000 -290,000,000 -295,000,000 10,416,000,000 11,759,000,000 11,824,000,000 15,442,000,000 12,724,000,000 12,711,000,000 10,955,000,000 26,733,000,000' 4,512,000,000 255,000,000 6,718,000,000 7,529,000,000 -6,759,000,000 -17,568,000,000 -1,264,000,000 -1,302,000,000 -1,351,000,000 -1,029,000,000 -815,000,000 -1,007,000,000 -1,224,000,000 -1,114,000,000 -1,175,000,000 -1,189,000,000 -933,000,000 -718,000,000 -937,000,000 -1,032,000,000 -1,114,000,000 -1,175,000,000 -1,189,000,000 -933,000,000 -718,000,000 -937,000,000 -1,032,000,000 -1,239,000,000 -1,210,000,000 -1,204,000,000 -937,000,000 -735,000,000 -978,000,000 -1,065,000,000 125,000,000 35,000,000 15,000,000 4,000,000 17,000,000 41,000,000 33,000,000 -150.000.000 - 127,000,000 -162,000,000 -96.000.000 -97,000,000 -70,000,000 -192,000,000 -150,000,000 -127,000,000 -162,000,000 -96,000,000 -97,000,000 -70,000,000 -192,000,000 27,822,000,000 5,557,000,000 1,390,000,000 7,794,000,000 8,298,000,000 -5,712,000,000 -15,156,000,000 93,000,000 228,000,000 199,000,000 67,000,000 233,000,000 76,000,000 -25,000,000 -4,000,000 133,000,000 23,000,000 82,000,000 111,000,000 76,000,000 -25,000,000 97,000,000 95,000,000 176,000,000 -15,000,000 122,000,000 0 27,729,000,000 5,329,000,000 1,191,000,000 7,991,000,000 8,065,000,000 -5,788,000,000 -15,131,000,000 27,729,000,000 5,329,000,000 1,191,000,000 7,991,000,000 8,065,000,000 -5,788,000,000 -15,131,000,000 -264,000,000 175,000,000 257,000,000 216,000,000 -47,000,000 46,000,000 -40,000,000 -1,188,000,000 37,149,000,000 16,271,000,000 12,079,000,000 22,160,000,000 20,253,000,000' 5,952,000,000 -6,613,000,000 -1,684,000,000 -1,968,000,000 -1,895,000,000 -4,267,000,000 -1,994,000,000 -1,961,000,000 -1,322,000,000 35,465,000,000 14,303,000,000 10,184,000,000 17,893,000,000 18,259,000,000 3,991,000,000 -7,935,000,000 07 Net Income after Extraordinary Items and Discontinued Operations Non-Controlling/Minority Interests Net Income after Non-Controlling/Minority Interests Net Income Available to Common Stockholders Diluted Net Income Available to Common Stockholders Reported Total Revenue Reported Normalized Income Irregular Items, Supplemental Asset Disposals, Supplemental Impairment/Write Off/Write Down of Other Assets, Supplemental Auditor Fees, Supplemental Non-Audit Fees Paid to Auditor, Supplemental Basic EPS Diluted EPS Basic WASO Diluted WASO Fiscal year ends in Dec 31 HKD 35,465,000,000 14,303,000,000 10,184,000,000 17,893,000,000 18,259,000,000 3,991,000,000 -7,935,000,000 -338.000.000 -516,000,000 -267,000,000 -675,000,000 -232,000,000 35,127,000,000 13,787,000,000 -63,000,000 420,000,000 9,917,000,000 17,218,000,000 18,027,000,000 3,928,000,000 -7,515,000,000 35,127,000,000 13,787,000,000' 9,917,000,000 17,218,000,000 18,027,000,000 3,928,000,000 -7,515,000,000 35,127,000,000 13,787,000,000 9,917,000,000 17,218,000,000 18,027,000,000 3,928,000,000 -7,515,000,000 17,437,000,000 17,576,000,000 16,851,000,000 20,904,000,000 16,481,000,000 16,043,000,000 14,320,000,000 8,516,000,000 9,500,000,000 10,053,000,000' 9,791,000,000 8,451,000,000 -4,000,000 0 07 0 -4,000,000 -16,000,000 -8,000,000 -8,000,000 -2,000,000 07 11.57 4.54 3.27 5.67 5.94 1.29 -2.48 11.57 4.547 3.271 5.67 5.94 1.29 -2.48 3,036,227,327' 3,036,227,327' 3,036,227,327' 3,036,000,000 3,036,000,000 3,036,000,000 3,036,227,327' 3,036,227,327' 3,036,227,327' 3,036,000,000 3,036,000,000 3,036,000,000 3,036,000,000 3,036,000,000 0Step by Step Solution
There are 3 Steps involved in it
Step: 1

Get Instant Access to Expert-Tailored Solutions
See step-by-step solutions with expert insights and AI powered tools for academic success
Step: 2

Step: 3
Ace Your Homework with AI
Get the answers you need in no time with our AI-driven, step-by-step assistance
Get Started
Options Trading For Beginners
Authors: Mike Hartley
1st Edition
979-8864514832