

Answered step by step
Verified Expert Solution
Question
1 Approved Answer
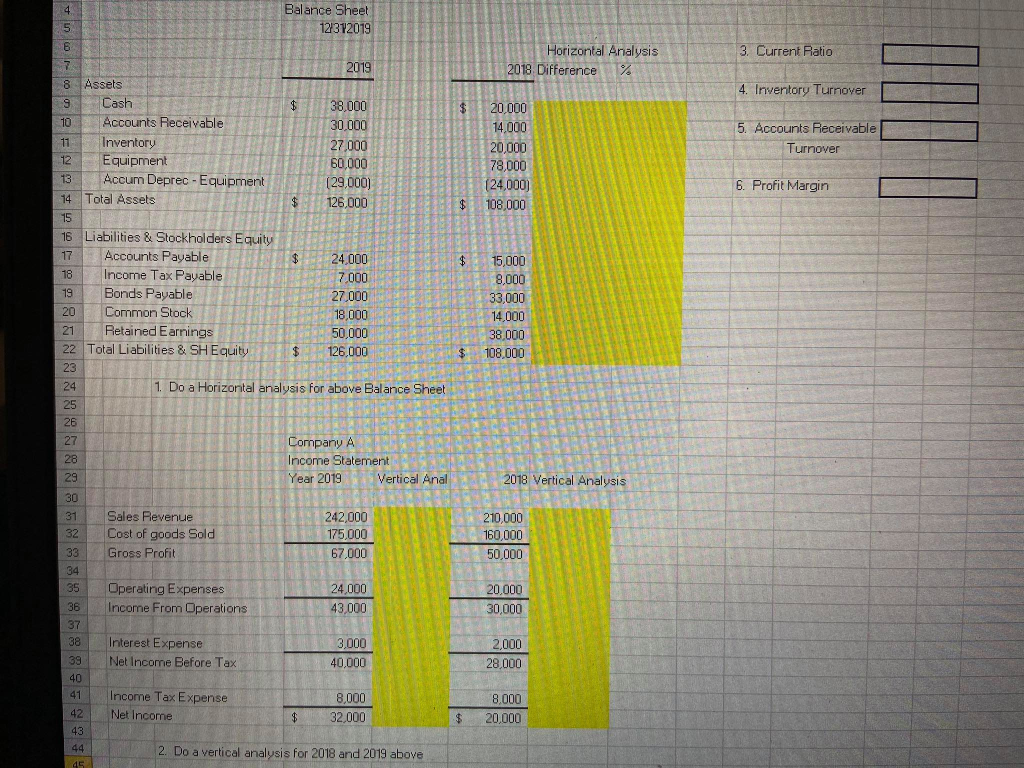
Balance Sheet IR 12392019 3. Current Ratio 2019 Horizontal Analysis 2018 Difference % G 4. Inventory Turnover $ 8 Assets Cash Accounts Receivable Inventory Equipment
Step by Step Solution
There are 3 Steps involved in it
Step: 1

Get Instant Access to Expert-Tailored Solutions
See step-by-step solutions with expert insights and AI powered tools for academic success
Step: 2

Step: 3
Ace Your Homework with AI
Get the answers you need in no time with our AI-driven, step-by-step assistance
Get Started
Audit Workbook
Authors: Azhar Ul Haque Sario
1st Edition
B0C9SG1YC6, 979-8851207891