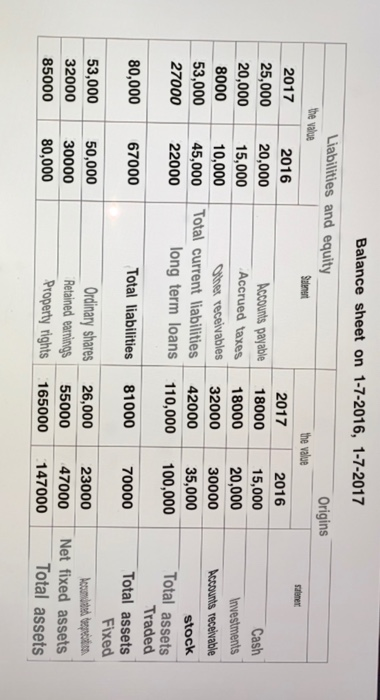
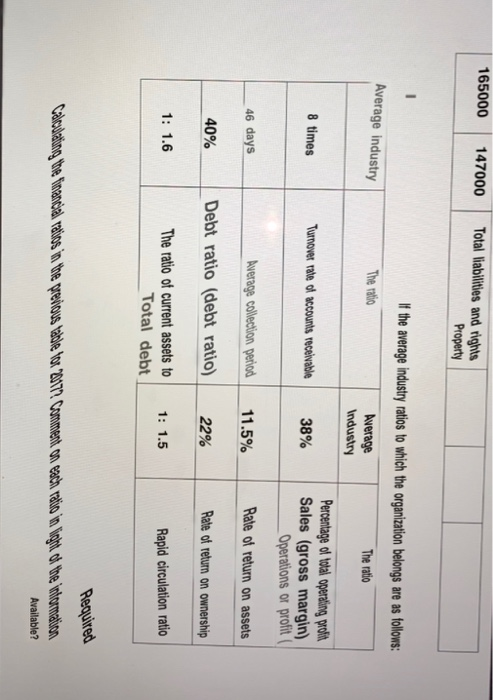
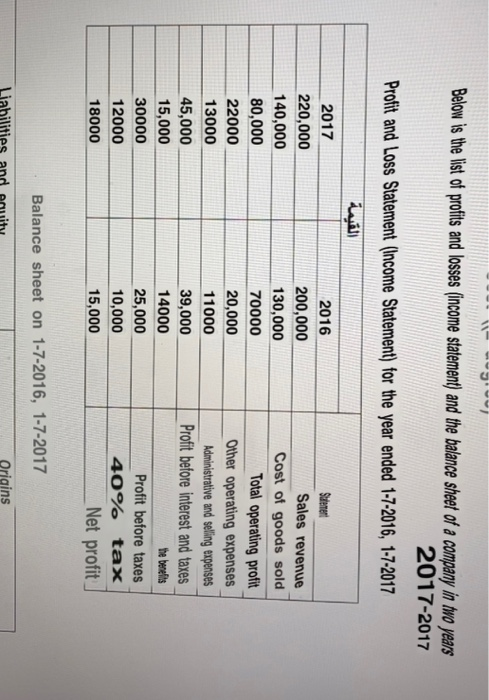
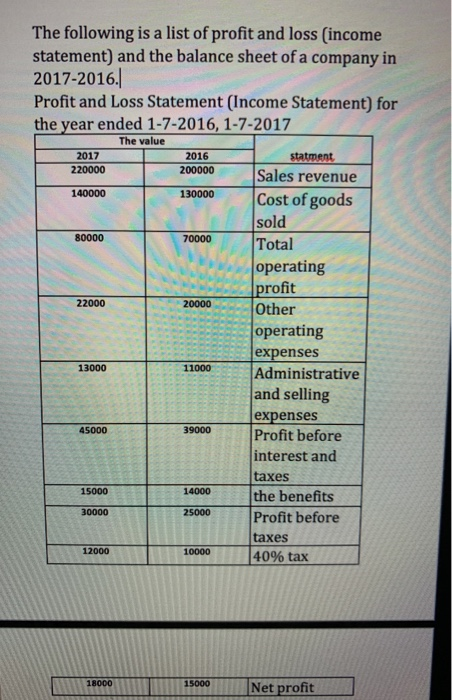
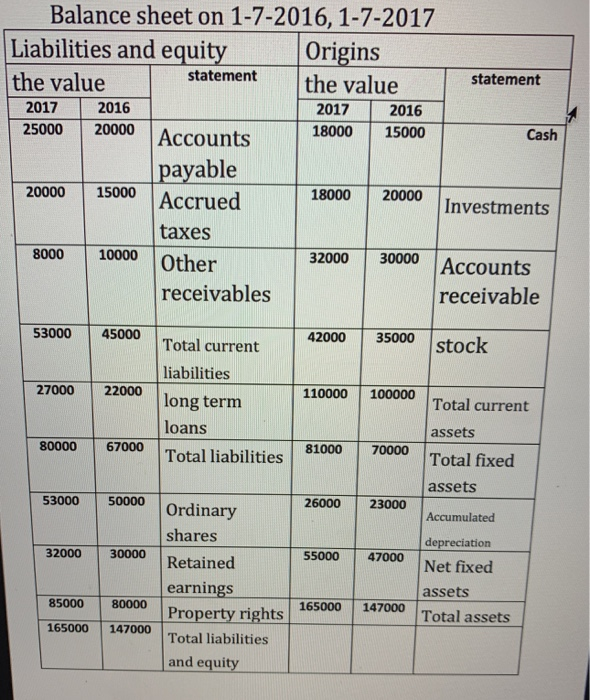
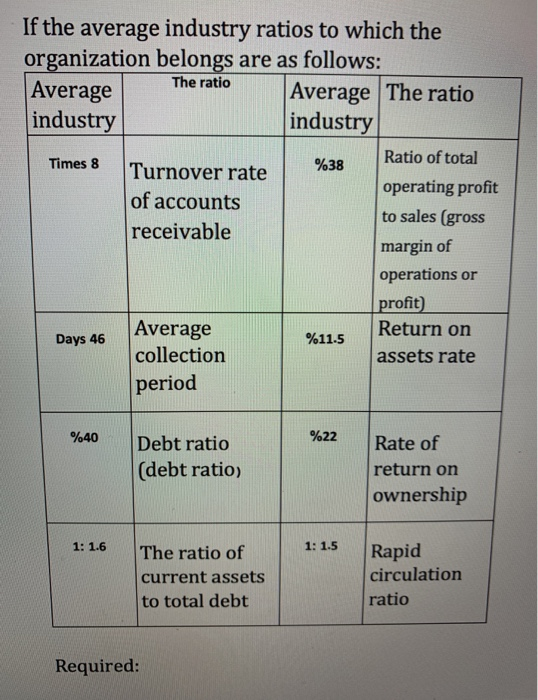
Balance sheet on 1-7-2016, 1-7-2017 Liabilities and equity Origins the value Sulinet the value 2017 2016 2017 2016 25,000 20,000 Accounts payable 18000 15,000 Cash 20,000 15,000 Accrued taxes 18000 20,000 Investments 8000 10,000 he receivables 32000 30000 Arraunts receivable 53,000 45,000 Total current liabilities 42000 35,000 stock 27000 22000 long term loans 110,000 100,000 Traded 80,000 67000 Total liabilities 81000 70000 Total assets Fixed 53,000 50,000 Ordinary shares 26,000 23000 Document espection 32000 30000 Retained earnings 55000 47000 Net fixed assets 85000 80,000 Property rights 165000 147000 Total assets Total assets 165000 147000 Total liabilities and rights Property Average industry If the average industry ratios to which the organization belongs are as follows: The ratio Average The ratio Industry Percentage of total operating profit Tumover rate of accounts receivable 38% Sales (gross margin) Operations or profit 8 times 46 days Average collection period 11.5% Rate of return on assets 40% Debt ratio (debt ratio) 22% Rate of return on ownership 1: 1.6 The ratio of current assets to Total debt 1: 1.5 Rapid circulation ratio Required Carding the model aknas in the precious talle var "2177 comment on each realiza in got the theamaian Available? go Below is the list of profits and losses (income statement) and the balance sheet of a company in two years 2017-2017 Profit and Loss Statement (Income Statement) for the year ended 1-7-2016, 1-7-2017 2017 220,000 140,000 80,000 22000 13000 45,000 15,000 30000 12000 18000 2016 200,000 130,000 70000 20,000 11000 39,000 14000 25,000 10,000 15,000 Statement Sales revenue Cost of goods sold Total operating profit Other operating expenses Administrative and selling expenses Profit before interest and taxes the bereits Profit before taxes 40% tax Net profit Balance sheet on 1-7-2016, 1-7-2017 Liabilities and Origins The following is a list of profit and loss income statement) and the balance sheet of a company in 2017-2016. Profit and Loss Statement (Income Statement) for the year ended 1-7-2016, 1-7-2017 The value 2017 220000 2016 200000 140000 130000 80000 70000 22000 20000 statment Sales revenue Cost of goods sold Total operating profit Other operating expenses Administrative and selling expenses Profit before interest and taxes the benefits Profit before taxes 40% tax 13000 11000 45000 39000 15000 14000 30000 25000 12000 10000 18000 15000 Net profit Balance sheet on 1-7-2016, 1-7-2017 Liabilities and equity Origins statement statement the value the value 2017 2016 2017 2016 25000 20000 18000 15000 Accounts Cash payable 20000 15000 18000 20000 Accrued Investments taxes 8000 10000 Other 32000 30000 Accounts receivables receivable 53000 45000 42000 35000 stock 27000 22000 110000 100000 Total current liabilities long term loans Total liabilities Total current assets 80000 67000 81000 70000 Total fixed assets 53000 50000 26000 23000 Accumulated 32000 30000 55000 47000 Ordinary shares Retained earnings Property rights Total liabilities and equity depreciation Net fixed assets Total assets 85000 80000 165000 147000 165000 147000 If the average industry ratios to which the organization belongs are as follows: Average Average The ratio industry industry The ratio Times 8 %38 Ratio of total Turnover rate of accounts receivable operating profit to sales (gross margin of operations or profit) Return on assets rate Days 46 %11.5 Average collection period %40 %22 Debt ratio (debt ratio) Rate of return on ownership 1: 1.6 1: 1.5 The ratio of current assets to total debt Rapid circulation ratio Required: current assets to total debt circulation ratio Required: Calculating the financial ratios in the previous table for 2017? And comment on each ratio in light of the available information