Answered step by step
Verified Expert Solution
Link Copied!

Question

1 Approved Answer

Balance sheets and income statements for the home depot inc. and lowe's companies inc . 1.Compute return on equity, return on assets, and return on

Balance sheets and income statements for the home depot inc. and lowe's companies inc .

1.Compute return on equity, return on assets, and return on financial leverage for each company in 2014

2. Disaggregate the ROA's computed into profit margin (PM) and asset turnover (AT) components. Which of these factors drives ROA for each company?

3. Compute the gross profit margin (GPM) and operating expense-to-sales ratios for each company. How do these companies' profitability measures compare?

4. Compute the accounts receivable turnover (ART), inventory turnover (INVT), and property, plant, and equipment turnover (PPET) for each company. How do these companies, turnover measures compare?

5. Compare and evaluate these competitors' performance in 2014.image text in transcribed

Analyzing and interpreting Financial Statements * COMPANIES NIE HOME DEPOT, INC. LOWE'S CO Balance Sheets Balancs 2014 2013 2014 2013 (5 millions $ $ 1,929 $ 1,723 456 125 391 195 1,484 11,079 9.12 1,398 11.057 895 15,279 23,348 1.289 1,016 15,302 22,720 1,353 8,911 578 10,080 20,034 593 1024 20034 278 571 $39.946 602 $40,518 354 1,359 $31,827 $32,730 Assets Cash and cash equivalents Short-term investments Receivables, net Merchandise inventories Other current assets Total current assets Property and equipment, net.. Goodwill Long-term investments Other assets. Total assets. Liabilities and shareholders' equity Short-term debt and current maturities of long-term debt ... Accounts payable... Accrued compensation and related expenses... Deferred revenue.. . Income taxes payable ..................... Other current liabilities..... Total current liabilities. ..... Long-term debt, excluding current maturities ..... Deferred income taxes... Other long-term liabilities ....... $ 552 5435 5,807 1,391 1,468 5,797 1,428 1,337 5,124 773 979 35 12 2,240 1.920 11,269 16,869 642 2.142 10,749 14,691 514 2,042 27,996 12,522 9,348 10,815 97 1,599 21,859 9,968 1.756 8,876 10,086 291 1,626 20,879 11,853 1,844 30,624 9,322 Total liabilities Total stockholders' equity ...... $39,946 $40,518 $31,827 $32,732 Total liabilities and shareholders' equity. ... HOME DEPOT, INC. LOWE'S COMPANIES Income Statements Income Statements 2014 ($ millions) 2013 2014 $56,223 36,665 19,558 13,281 1,485 $53,417 34,941 18.476 12,865 1,462 2013 $78,812 51,422 27,390 16,597 1,627 9.166 12 711 8,467 3,082 $ 5,385 $83,176 54,222 28,954 16,834 1,651 10,469 337 830 9,976 3,631 $ 6,345 Net sales. .... Cost of sales. Gross profit Selling, general and administrative. Depreciation and amortization ..... Operating income.. Investment and other income... Interest expense.... Earnings before income taxes Provision for income taxes..... Net earnings. 4,792 4,149 480 3,673 522 4,276 1,578 $ 2,698 1,387 $ 2,286 $ 2,698

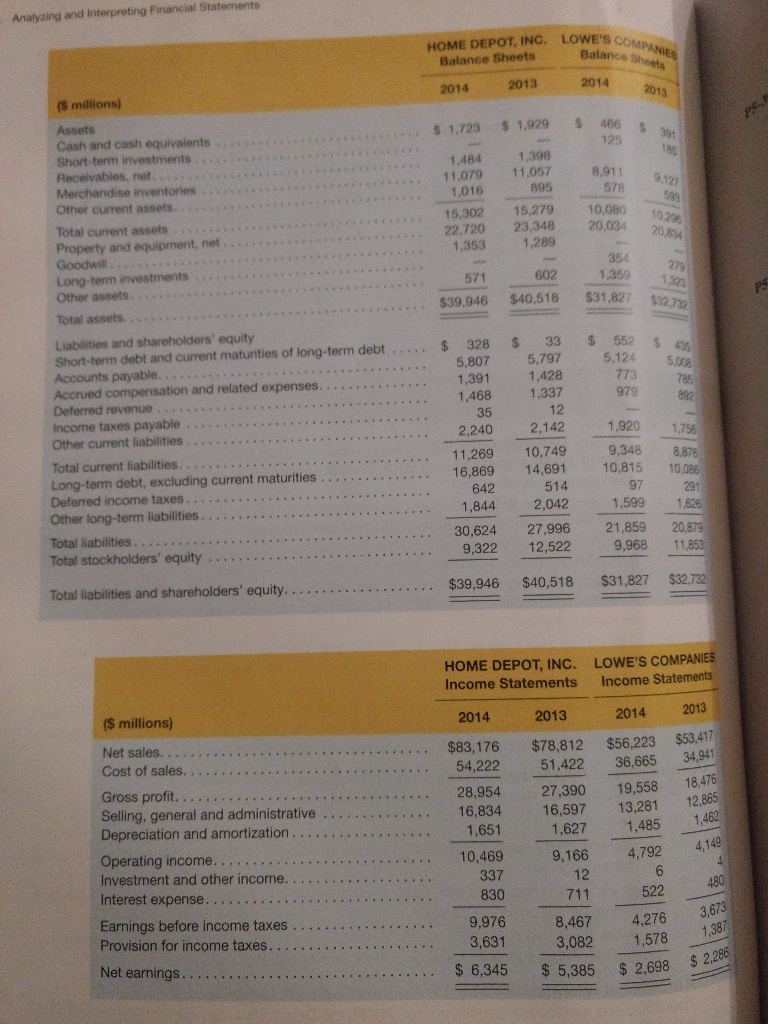
Step by Step Solution

There are 3 Steps involved in it

Step: 1

blur-text-image

Get Instant Access to Expert-Tailored Solutions

See step-by-step solutions with expert insights and AI powered tools for academic success

Step: 2

blur-text-image

Step: 3

blur-text-image

Ace Your Homework with AI

Get the answers you need in no time with our AI-driven, step-by-step assistance

Get Started

Students also viewed these Accounting questions