

Answered step by step
Verified Expert Solution
Question
1 Approved Answer
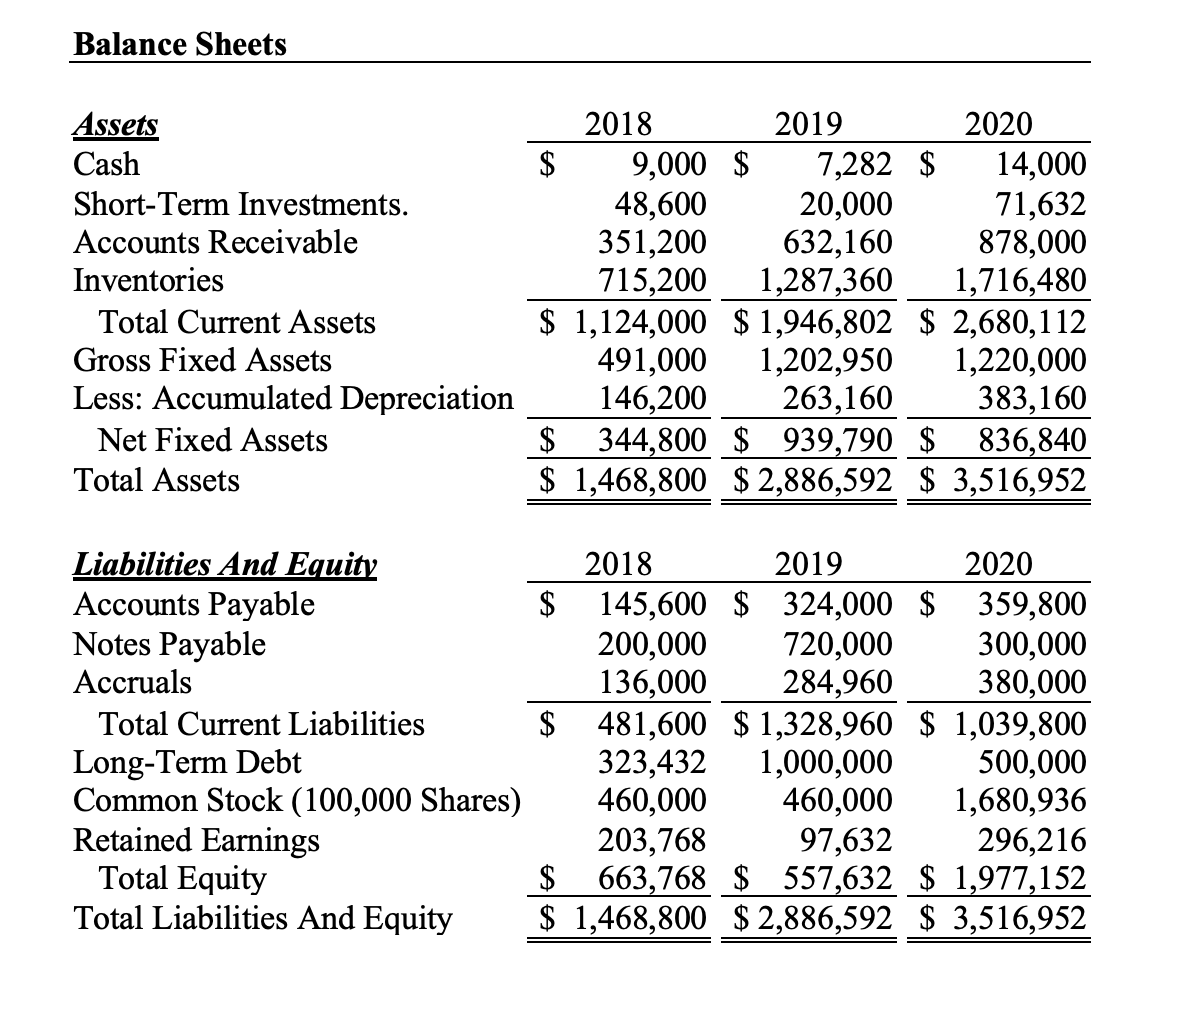
Balance Sheets Assets Cash Short-Term Investments. Accounts Receivable Inventories Total Current Assets Gross Fixed Assets Less: Accumulated Depreciation Net Fixed Assets Total Assets 2018 2019
Step by Step Solution
There are 3 Steps involved in it
Step: 1

Get Instant Access to Expert-Tailored Solutions
See step-by-step solutions with expert insights and AI powered tools for academic success
Step: 2

Step: 3
Ace Your Homework with AI
Get the answers you need in no time with our AI-driven, step-by-step assistance
Get Started
Microfinance Handbook An Institutional And Financial Perspective
Authors: Joanna Ledgerwood
1st Edition
0821343068, 978-0821343067