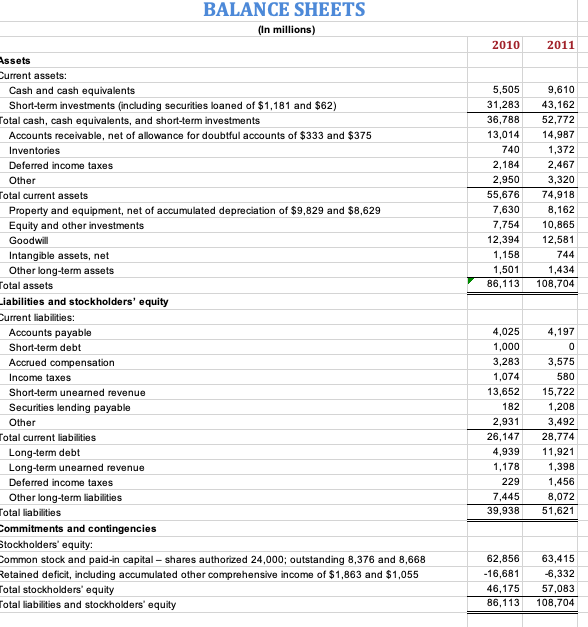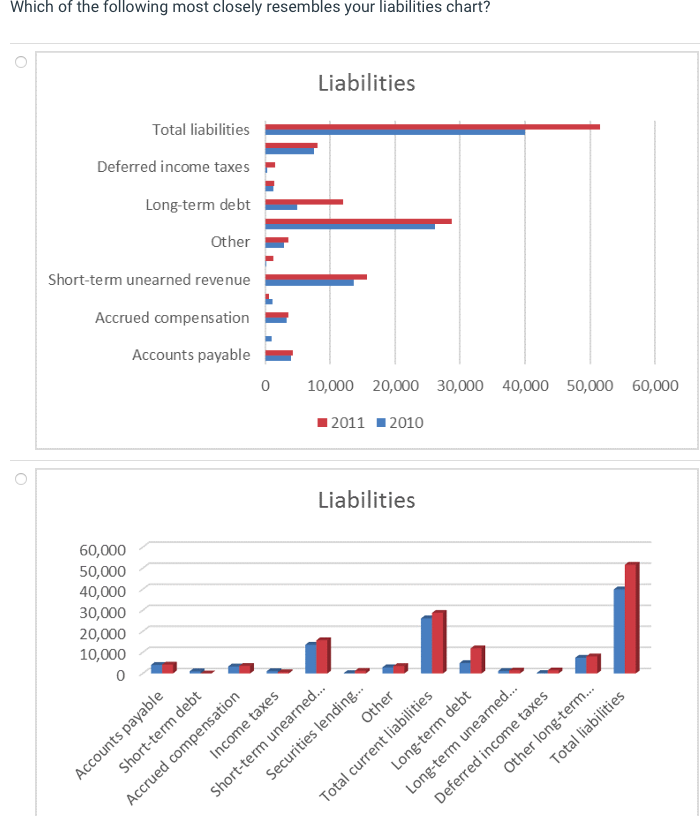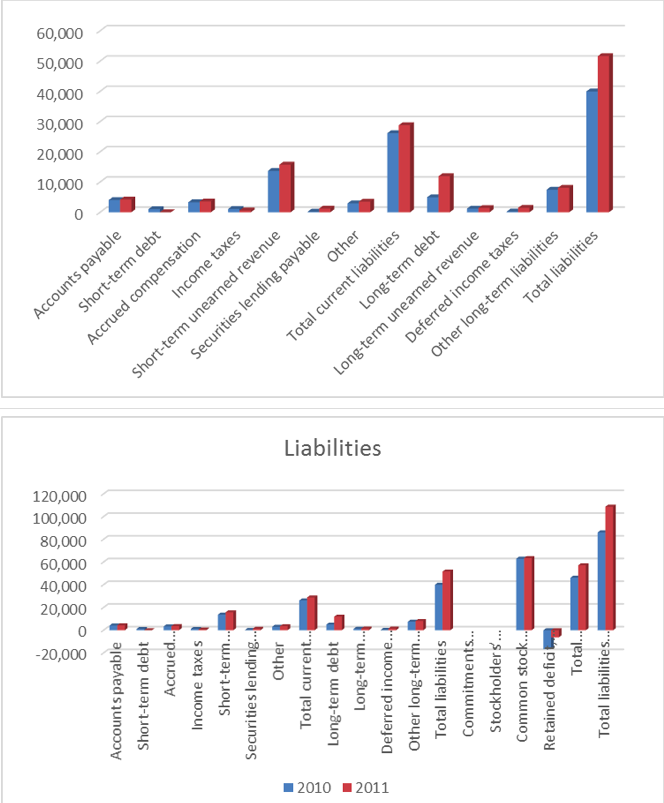


BALANCE SHEETS (In millions) 2010 2011 5,505 31,283 36,788 13,014 740 2,184 2,950 55,676 7,630 7,754 12,394 1,158 1,501 86,113 9,610 43,162 52,772 14,987 1,372 2,467 3,320 74,918 8,162 10,865 12,581 744 1,434 108,704 Assets Current assets: Cash and cash equivalents Short-term investments (including securities loaned of $1,181 and $62) Total cash, cash equivalents, and short-term investments Accounts receivable, net of allowance for doubtful accounts of $333 and $375 Inventories Deferred income taxes Other Total current assets Property and equipment, net of accumulated depreciation of $9,829 and $8,629 Equity and other investments Goodwill Intangible assets, net Other long-term assets Total assets Liabilities and stockholders' equity Current liabilities: Accounts payable Short-term debt Accrued compensation Income taxes Short-term unearned revenue Securities lending payable Other Total current liabilities Long-term debt Long-term unearned revenue Deferred income taxes Other long-term liabilities Total liabilities Commitments and contingencies Stockholders' equity: Common stock and paid-in capital - shares authorized 24,000; outstanding 8,376 and 8,668 Retained deficit, including accumulated other comprehensive income of $1,863 and $1,055 Total stockholders' equity Total liabilities and stockholders' equity 4,025 1,000 3,283 1,074 13,652 182 2,931 26, 147 4,939 1,178 229 7,445 39,938 4,197 0 3,575 580 15,722 1,208 3,492 28,774 11,921 1,398 1,456 8,072 51,621 62,856 -16,681 46,175 86,113 63,415 -6,332 57,083 108,704 Which of the following most closely resembles your liabilities chart? . Liabilities Total liabilities Deferred income taxes Long-term debt Other Short-term unearned revenue Accrued compensation Accounts payable 0 10,000 20,000 30,000 40,000 50,000 60,000 2011 2010 . Liabilities 60,000 50,000 40,000 30,000 20,000 10,000 0 Long-term debt Long-term unearned... Deferred income taxes Other long-term... Total liabilities Accounts payable Short-term debt Accrued compensation Income taxes Short-term unearned... Securities lending... Other Total current liabilities -20,000 20,000 40,000 60,000 80,000 100,000 120,000 10,000 20,000 30,000 40,000 50,000 60,000 0 o 0 Accounts payable Short-term debt Accrued compensation Short-term unearned revenue Securities lending payable Income taxes Total current liabilities Other 2010 2011 Accounts payable Short-term debt Accrued... Income taxes Short-term... Securities lending... Other Total current... Long-term debt Long-term... Deferred income... Other long-term... Total liabilities Commitments... Stockholders... Common stock... Retained de fic Total... Total liabilities... Liabilities Other long-term liabilities Deferred income taxes Long-term debt Long-term unearned revenue Total liabilities


