

Answered step by step
Verified Expert Solution
Question
1 Approved Answer
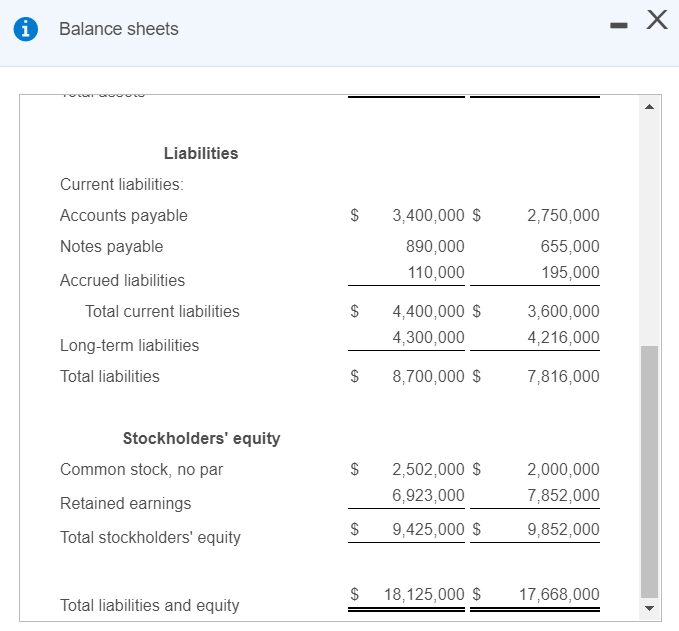
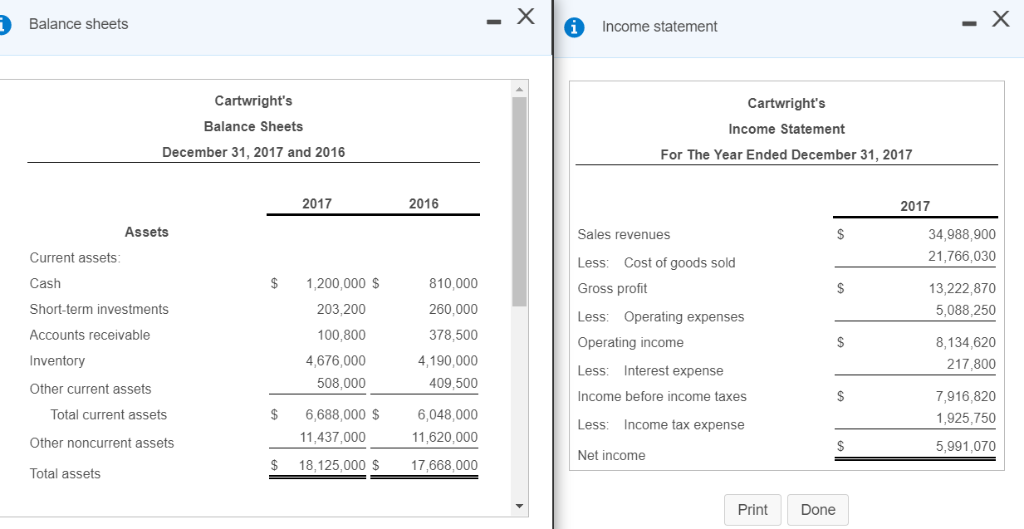
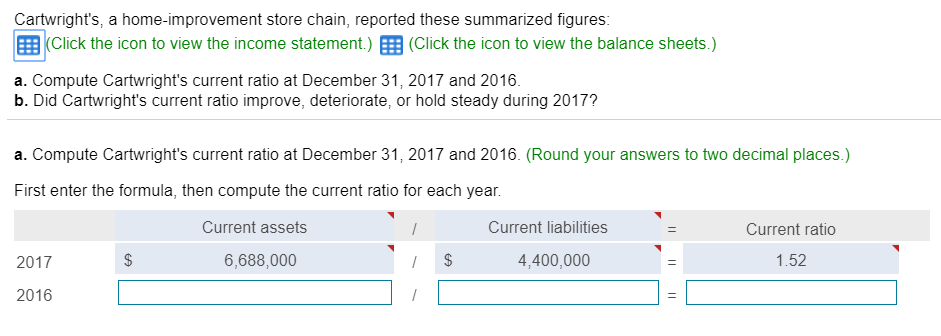
Balance sheets Income statement Cartwright's Balance Sheets December 31, 2017 and 2016 Cartwrigh's Income Statement For The Year Ended December 31, 2017 2017 2016 2017
Step by Step Solution
There are 3 Steps involved in it
Step: 1

Get Instant Access to Expert-Tailored Solutions
See step-by-step solutions with expert insights and AI powered tools for academic success
Step: 2

Step: 3
Ace Your Homework with AI
Get the answers you need in no time with our AI-driven, step-by-step assistance
Get Started
Fundamental Financial Accounting Concepts Paperback By Edmonds Thomas P O
Authors: Thomas P. Edmonds, Christopher Edmonds, Mark A. Edmonds, Jennifer Edmonds, Philip R. Olds
11th Edition
9781264266234, 1264266235