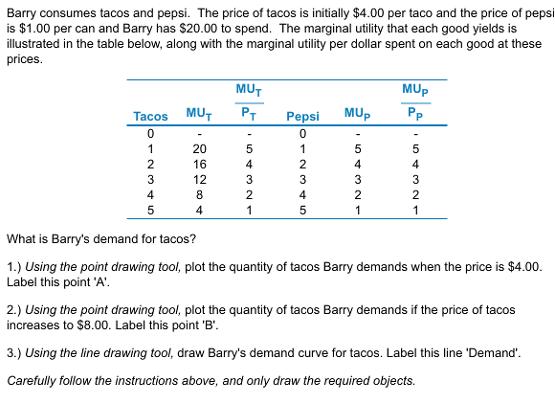
Barry consumes tacos and pepsi. The price of tacos is initially $4.00 per taco and the price of pepsi is $1.00 per can and


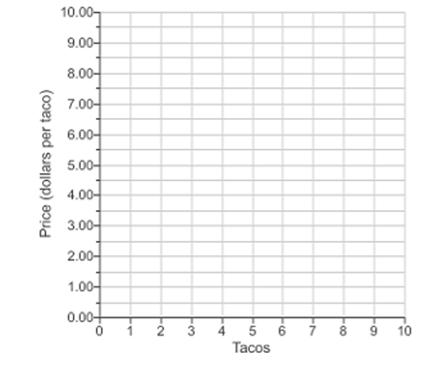
Barry consumes tacos and pepsi. The price of tacos is initially $4.00 per taco and the price of pepsi is $1.00 per can and Bary has $20.00 to spend. The marginal utility that each good yields is illustrated in the table below, along with the marginal utility per dollar spent on each good at these prices MUT MUP MUT PT MUP PP Pepsi cos 0 0 20 5 1 5 5 2 16 2 4 4 3 12 3 3 3 3 4 8 2 4 2 5 4 5 1 1 What is Barry's demand for tacos? 1.) Using the point drawing tool, plot the quantity of tacos Barry demands when the price is $4.00. Label this point 'A. 2) Using the point drawing tool, plot the quantity of tacos Barry demands if the price of tacos increases to $8.00. Label this point 'B. 3.) Using the line drawing tool, draw Barry's demand curve for tacos. Label this line 'Demand'. Carefully follow the instructions above, and only draw the required objects. 10.00 9.00- 8.00- 7.00- 6.00- 5.00- 4.00- 3.00- 2.00- 1.00 0.00 8 9 6 Tacos 7 10 3 Price (dollars per taco)
Step by Step Solution
3.54 Rating (157 Votes )
There are 3 Steps involved in it
Step: 1

See step-by-step solutions with expert insights and AI powered tools for academic success
Step: 2

Step: 3

Ace Your Homework with AI
Get the answers you need in no time with our AI-driven, step-by-step assistance
Get Started


