Answered step by step
Verified Expert Solution
Question
1 Approved Answer
Bartels (1982) illustrated the RVN test for randomness using data on annual changes in stock levels of corporate trading enterprises in Australia for 1968-1969

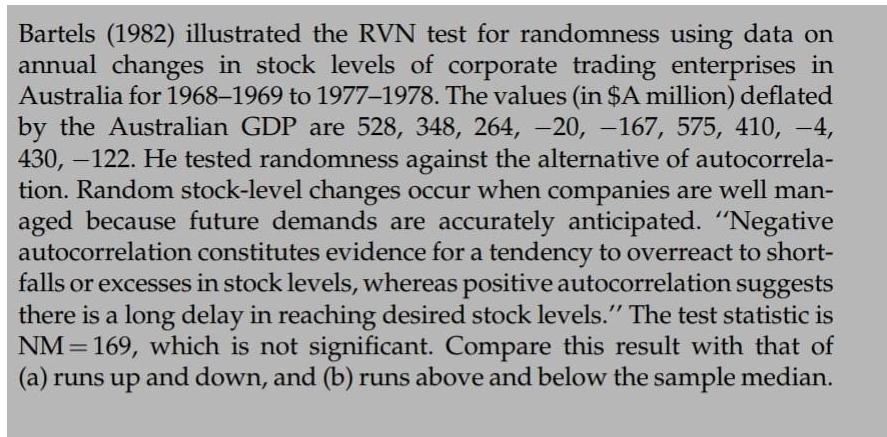
Bartels (1982) illustrated the RVN test for randomness using data on annual changes in stock levels of corporate trading enterprises in Australia for 1968-1969 to 1977-1978. The values (in $A million) deflated by the Australian GDP are 528, 348, 264, -20, -167, 575, 410, -4, 430, -122. He tested randomness against the alternative of autocorrela- tion. Random stock-level changes occur when companies are well man- aged because future demands are accurately anticipated. "Negative autocorrelation constitutes evidence for a tendency to overreact to short- falls or excesses in stock levels, whereas positive autocorrelation suggests there is a long delay in reaching desired stock levels." The test statistic is NM = 169, which is not significant. Compare this result with that of (a) runs up and down, and (b) runs above and below the sample median.
Step by Step Solution
★★★★★
3.40 Rating (181 Votes )
There are 3 Steps involved in it
Step: 1
The RVN Runs Versus Normality test is a test of randomness that examines the runs of positive and negative values in a data set In Bartels study he us...
Get Instant Access to Expert-Tailored Solutions
See step-by-step solutions with expert insights and AI powered tools for academic success
Step: 2

Step: 3

Ace Your Homework with AI
Get the answers you need in no time with our AI-driven, step-by-step assistance
Get Started


