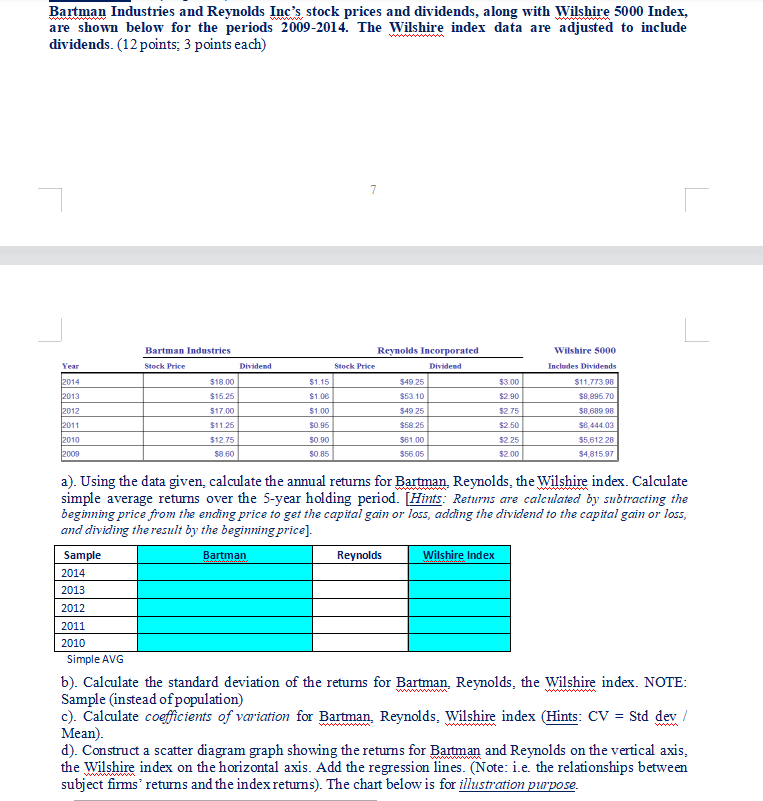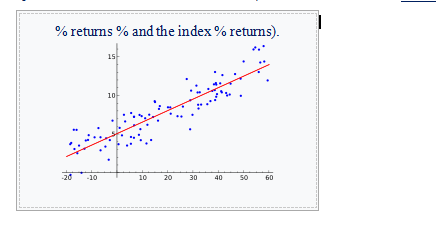

Bartman Industries and Reynolds Inc's stock prices and dividends, along with Wilshire 5000 Index, are shown below for the periods 2009-2014. The Wilshire index data are adjusted to include dividends. (12 points: 3 points each) 7 1 Year 2014 2013 2012 Bartman Industries Stock Price Dividend $18.00 $15.25 $17.00 $1.15 $1.00 $3.00 $2.90 Reynolds Incorporated Stock Price Dividend $49 25 $63.10 $49 25 $58 25 $61.00 $56.05 Wilshire 5000 Includes Dividends $11.773.98 $8.996.70 $8 689.98 $8.444.03 $5.612 28 $4,815 97 $1.00 $0.96 $275 $2.50 2011 $1125 2010 2009 $12.75 58.60 50.90 50.85 $225 $2.00 Bartman a). Using the data given, calculate the annual returns for Bartman Reynolds, the Wilshire index. Calculate simple average returns over the 5-year holding period. (Hints: Returns are calculated by subtracting the beginning price from the ending price to get the capital gain or loss, adding the dividend to the capital gain or loss, and dividing the result by the beginning price]. Sample Reynolds Wilshire Index 2014 2013 2012 2011 2010 Simple AVG b). Calculate the standard deviation of the returns for Bartman Reynolds, the Wilshire index. NOTE: Sample (instead of population) c). Calculate coefficients of variation for Bartman Reynolds, Wilshire index (Hints: CV = Std dev/ Mean). d). Construct a scatter diagram graph showing the returns for Bartman and Reynolds on the vertical axis, the Wilshire index on the horizontal axis. Add the regression lines. (Note: i.e. the relationships between subject firms' returns and the index returns). The chart below is for illustration purpose. % returns % and the index % returns). 15 10 20 -10 10 30 40 50 60 Bartman Industries and Reynolds Inc's stock prices and dividends, along with Wilshire 5000 Index, are shown below for the periods 2009-2014. The Wilshire index data are adjusted to include dividends. (12 points: 3 points each) 7 1 Year 2014 2013 2012 Bartman Industries Stock Price Dividend $18.00 $15.25 $17.00 $1.15 $1.00 $3.00 $2.90 Reynolds Incorporated Stock Price Dividend $49 25 $63.10 $49 25 $58 25 $61.00 $56.05 Wilshire 5000 Includes Dividends $11.773.98 $8.996.70 $8 689.98 $8.444.03 $5.612 28 $4,815 97 $1.00 $0.96 $275 $2.50 2011 $1125 2010 2009 $12.75 58.60 50.90 50.85 $225 $2.00 Bartman a). Using the data given, calculate the annual returns for Bartman Reynolds, the Wilshire index. Calculate simple average returns over the 5-year holding period. (Hints: Returns are calculated by subtracting the beginning price from the ending price to get the capital gain or loss, adding the dividend to the capital gain or loss, and dividing the result by the beginning price]. Sample Reynolds Wilshire Index 2014 2013 2012 2011 2010 Simple AVG b). Calculate the standard deviation of the returns for Bartman Reynolds, the Wilshire index. NOTE: Sample (instead of population) c). Calculate coefficients of variation for Bartman Reynolds, Wilshire index (Hints: CV = Std dev/ Mean). d). Construct a scatter diagram graph showing the returns for Bartman and Reynolds on the vertical axis, the Wilshire index on the horizontal axis. Add the regression lines. (Note: i.e. the relationships between subject firms' returns and the index returns). The chart below is for illustration purpose. % returns % and the index % returns). 15 10 20 -10 10 30 40 50 60


