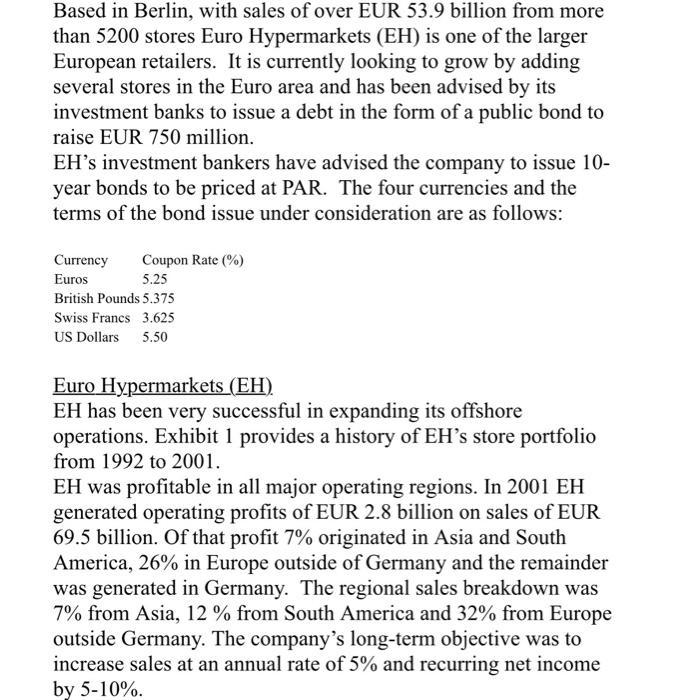
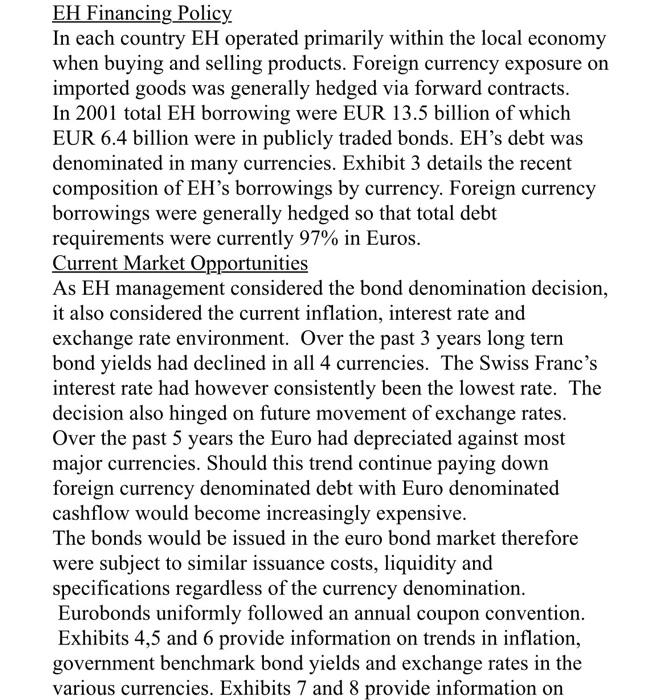
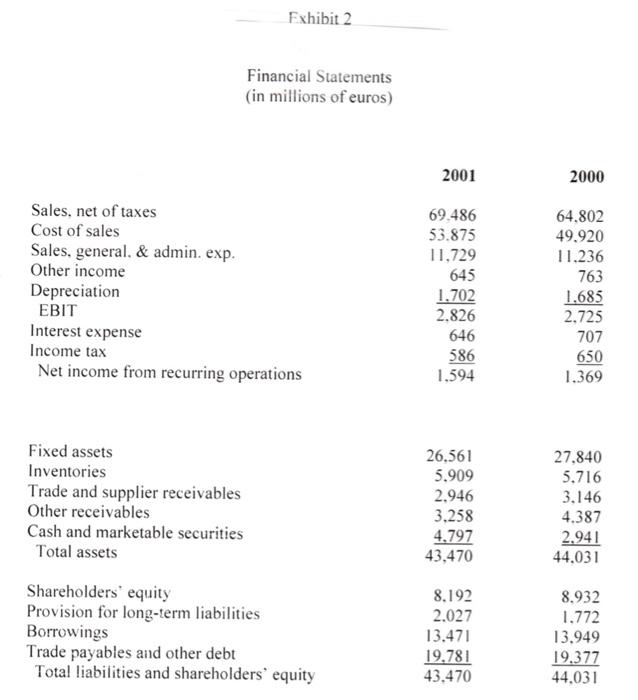
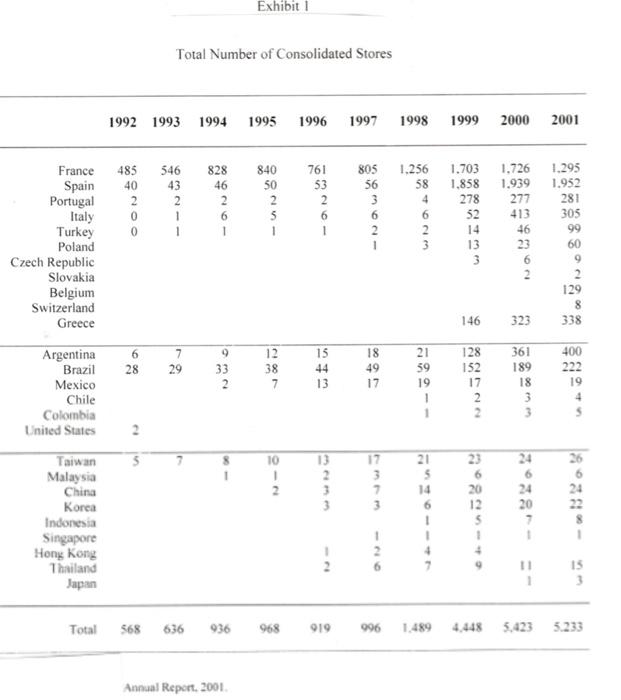
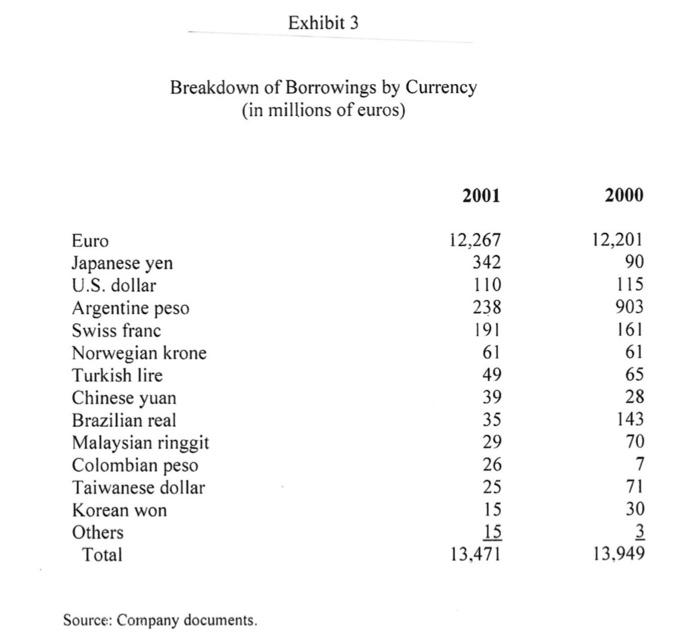
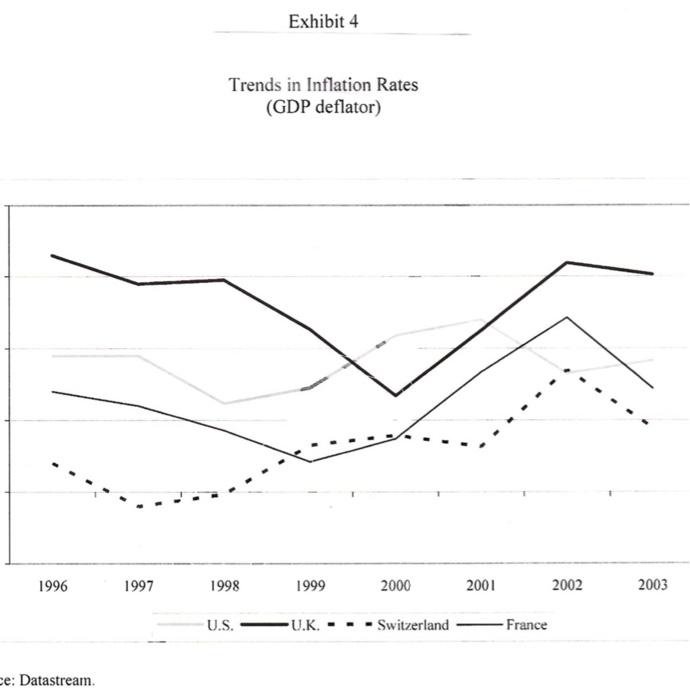
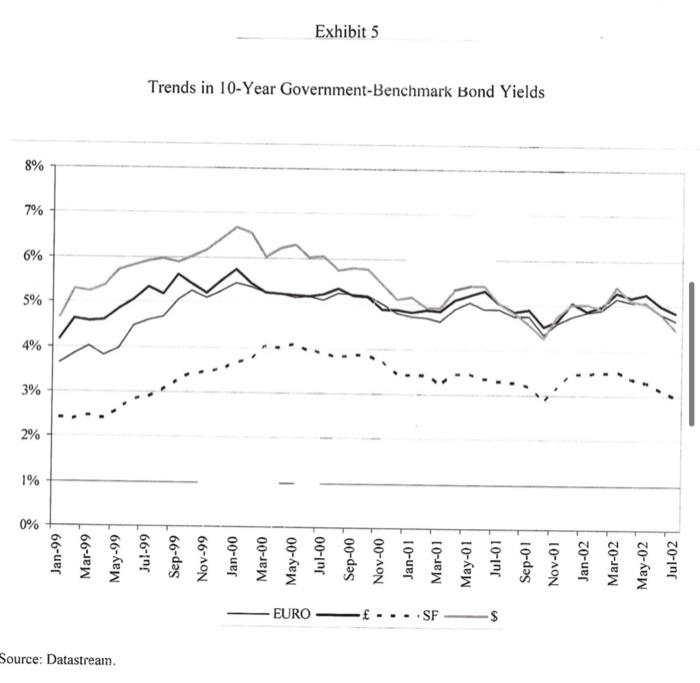
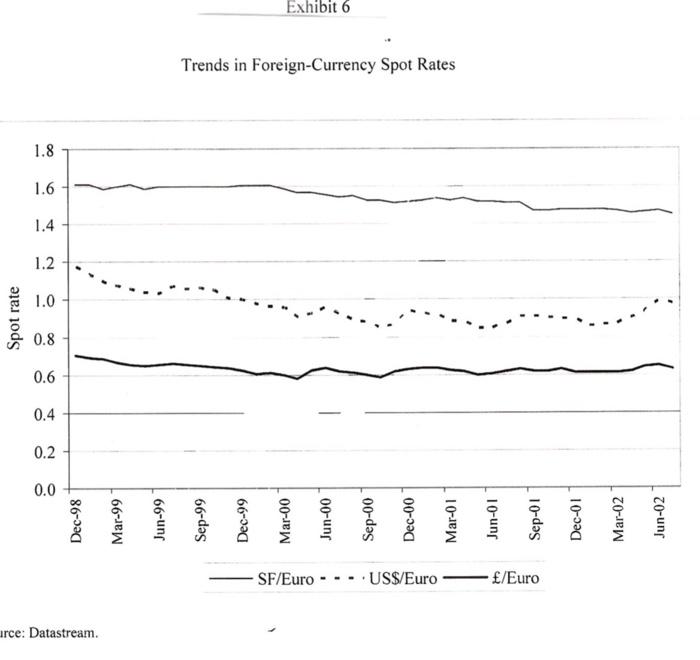
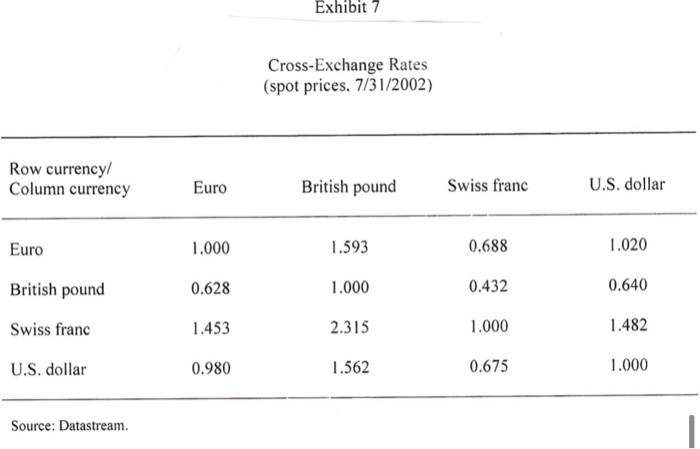
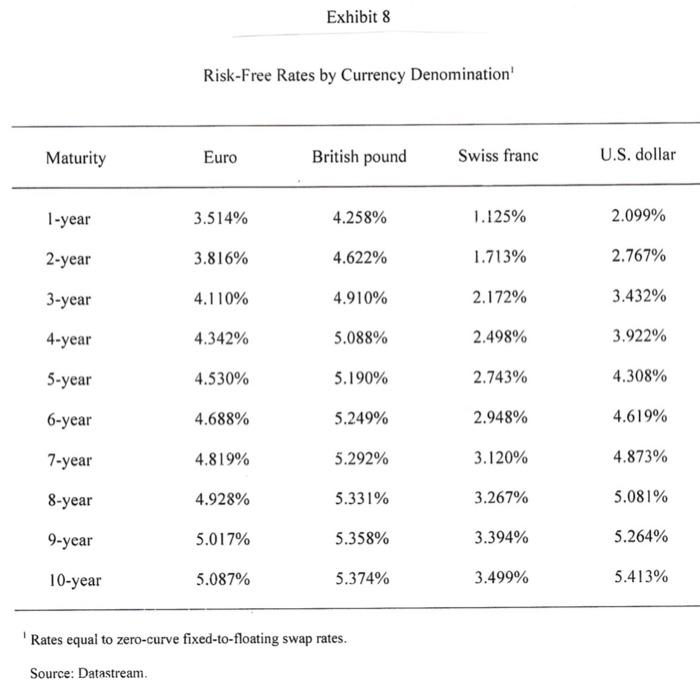
Based in Berlin, with sales of over EUR 53.9 billion from more than 5200 stores Euro Hypermarkets (EH) is one of the larger European retailers. It is currently looking to grow by adding several stores in the Euro area and has been advised by its investment banks to issue a debt in the form of a public bond to raise EUR 750 million. EH's investment bankers have advised the company to issue 10- year bonds to be priced at PAR. The four currencies and the terms of the bond issue under consideration are as follows: Currency Coupon Rate (%) Euros 5.25 British Pounds 5.375 Swiss Francs 3.625 US Dollars 5.50 Euro Hypermarkets (EH) EH has been very successful in expanding its offshore operations. Exhibit 1 provides a history of EH's store portfolio from 1992 to 2001. EH was profitable in all major operating regions. In 2001 EH generated operating profits of EUR 2.8 billion on sales of EUR 69.5 billion. Of that profit 7% originated in Asia and South America, 26% in Europe outside of Germany and the remainder was generated in Germany. The regional sales breakdown was 7% from Asia, 12 % from South America and 32% from Europe outside Germany. The company's long-term objective was to increase sales at an annual rate of 5% and recurring net income by 5-10% EH Financing Policy In each country EH operated primarily within the local economy when buying and selling products. Foreign currency exposure on imported goods was generally hedged via forward contracts. In 2001 total EH borrowing were EUR 13.5 billion of which EUR 6.4 billion were in publicly traded bonds. EH's debt was denominated in many currencies. Exhibit 3 details the recent composition of EH's borrowings by currency. Foreign currency borrowings were generally hedged so that total debt requirements were currently 97% in Euros. Current Market Opportunities As EH management considered the bond denomination decision, it also considered the current inflation, interest rate and exchange rate environment. Over the past 3 years long tern bond yields had declined in all 4 currencies. The Swiss Franc's interest rate had however consistently been the lowest rate. The decision also hinged on future movement of exchange rates. Over the past 5 years the Euro had depreciated against most major currencies. Should this trend continue paying down foreign currency denominated debt with Euro denominated cashflow would become increasingly expensive. The bonds would be issued in the euro bond market therefore were subject to similar issuance costs, liquidity and specifications regardless of the currency denomination. Eurobonds uniformly followed an annual coupon convention. Exhibits 4,5 and 6 provide information on trends in inflation, government benchmark bond yields and exchange rates in the various currencies. Exhibits 7 and 8 provide information on Instructions: Please read the attached case and answer the single question at the end. You are limited to one half of one page of text for your answer plus any calculations (excel based would be preferred) that you may use to support your answer. You may attach any such calculations separately in your email. Please answer the following question: Which bond would you advise EH's management to issue and why? Please provide all analysis that supports your recommendation. Fxhibit 2 Financial Statements (in millions of euros) 2001 2000 Sales, net of taxes Cost of sales Sales, general. & admin. exp. Other income Depreciation EBIT Interest expense Income tax Net income from recurring operations 69.486 53.875 11,729 645 1.702 2.826 646 586 1.594 64.802 49.920 11.236 763 1.685 2.725 707 650 1.369 Fixed assets Inventories Trade and supplier receivables Other receivables Cash and marketable securities Total assets 26,561 5.909 2.946 3.258 4,797 43,470 27.840 5.716 3.146 4.387 2.941 44,031 Shareholders' equity Provision for long-term liabilities Borrowings Trade payables and other debt Total liabilities and shareholders' equity 8.192 2.027 13.471 19.781 43.470 8.932 1.772 13.949 19.377 44.031 Exhibit Total Number of Consolidated Stores 1992 1993 1994 1995 1996 1997 1998 1999 2000 2001 485 40 2 0 0 546 43 2 1 828 46 2 6 840 50 2 5 1 761 53 2 6 France Spain Portugal Italy Turkey Poland Czech Republic Slovakia Belgium Switzerland Greece 805 56 3 6 2 1 1.256 58 4 6 2 1.703 1.858 278 52 14 13 3 1.726 1.295 1.939 1.952 277 281 413 305 46 99 23 60 6 9 2 129 8 323 338 146 6 28 7 29 33 2 12 38 7 44 13 18 49 17 Argentina Brazil Mexico Chile Colombia United States 21 59 19 1 128 152 17 2 361 189 18 3 3 400 222 19 4 1 A 21 5 14 1 23 6 20 26 6 2 7 6 24 20 Taiwan Malaysia China Korea Indonesia Singapore Hong Kong Thailand Japan 1 7 15 3 Total 568 636 968 919 996 4.448 5,423 5.233 Annual Report 2001 Exhibit 3 Breakdown of Borrowings by Currency (in millions of euros) 2001 2000 12,267 342 110 238 191 61 Euro Japanese yen U.S. dollar Argentine peso Swiss franc Norwegian krone Turkish lire Chinese yuan Brazilian real Malaysian ringgit Colombian peso Taiwanese dollar Korean won Others Total 12,201 90 115 903 161 61 65 28 143 49 39 35 29 26 25 70 7 71 15 30 15 13,471 3 13,949 Source: Company documents. Exhibit 4 Trends in Inflation Rates (GDP deflator) 1996 1997 1998 1999 2000 2001 2002 2003 U.S. -U.K. - Switzerland -France ce: Datastream 2% 3% 4% 5% %8 Source: Datastream. Jan-99 Mar-99 May-99 Jul-99 Sep-99 Nov-99 Jan-00 Mar-00 EURO May-00 Jul-00 1 Sep-00 Trends in 10-Year Government-Benchmark Bond Yields Exhibit 5 Nov-00 Jan-01 SF Mar-01 May-01 Jul-01 Sep-01 Nov-01 Jan-02 Mar-02 May-02 Jul-02 Spot rate irce: Datastream. 1.2 1.4 Dec-98 Mar-99 Jun-99 Sep-99 Dec-99 Mar-00 Jun-00 Exhibit 6 Trends in Foreign-Currency Spot Rates Sep-00 SF/Euro ---.US$/Euro /Euro Dec-00 Mar-01 Jun-01 Sep-01 Dec-01 Mar-02 Jun-02 Exhibit 7 Cross-Exchange Rates (spot prices. 7/31/2002) Row currency/ Column currency Euro British pound Swiss franc U.S. dollar Euro 1.000 1.593 0.688 1.020 0.628 1.000 0.432 0.640 British pound Swiss franc 1.453 2.315 1.000 1.482 U.S. dollar 0.980 1.562 0.675 1.000 Source: Datastream Exhibit 7 Cross-Exchange Rates (spot prices. 7/31/2002) Row currency/ Column currency Euro British pound Swiss franc U.S. dollar Euro 1.000 1.593 0.688 1.020 0.628 1.000 0.432 0.640 British pound Swiss franc 1.453 2.315 1.000 1.482 U.S. dollar 0.980 1.562 0.675 1.000 Source: Datastream Exhibit 8 Risk-Free Rates by Currency Denomination' Maturity Euro British pound Swiss franc U.S. dollar 1-year 3.514% 4.258% 1.125% 2.099% 2-year 3.816% 4.622% 1.713% 2.767% 3-year 4.110% 4.910% 2.172% 3.432% 4-year 4.342% 5.088% 2.498% 3.922% 5-year 4.530% 5.190% 2.743% 4.308% 6-year 4.688% 5.249% 2.948% 4.619% 7-year 4.819% 5.292% 3.120% 4.873% 8-year 4.928% 5.331% 3.267% 5.081% 9-year 5.017% 5.358% 3.394% 5.264% 10-year 5.087% 5.374% 3.499% 5.413% Rates equal to zero-curve fixed-to-floating swap rates. Source: Datastream
