Answered step by step
Verified Expert Solution
Question
1 Approved Answer
Based on above information, analyze the changes in the companys profitability and liquidity, in addition to the management of accounts receivable and inventory from 2018

Based on above information, analyze the changes in the company’s profitability and liquidity, in addition to the management of accounts receivable and inventory from 2018 to 2020. (Round answers to 1 decimal place, e.g. 13.5% or 13.5.)
| 2018 | 2019 | 2020 | ||||
| Sales | % | % | % | |||
| Cost of goods sold | % | % | % | |||
| Gross margin | % | % | % | |||
| Other expenses | % | % | % | |||
| Income taxes | % | % | % | |||
| Net income | % | % | % |
| 2018 | 2019 | 2020 | |||||||
| Current Ratio | : 1 | : 1 | : 1 | ||||||
| Quick Ratio | : 1 | : 1 | : 1 | ||||||
| A/R Turnover | times | times | times | ||||||
| Average Collection Period | days | days | days | ||||||
| Inventory Turnover | times | times | times | ||||||
| Days to Sell Inventory | days | days | days | ||||||
Based on the above information, analyze the company’s use of leverage from 2018 to 2020. (Round answers to 1 decimal place, e.g. 15.1%.)
| 2018 | 2019 | 2020 | ||||
| Debt to Equity | % | % | % | |||
| Return on Assets | % | % | % | |||
| Return on Equity | % | % | % |
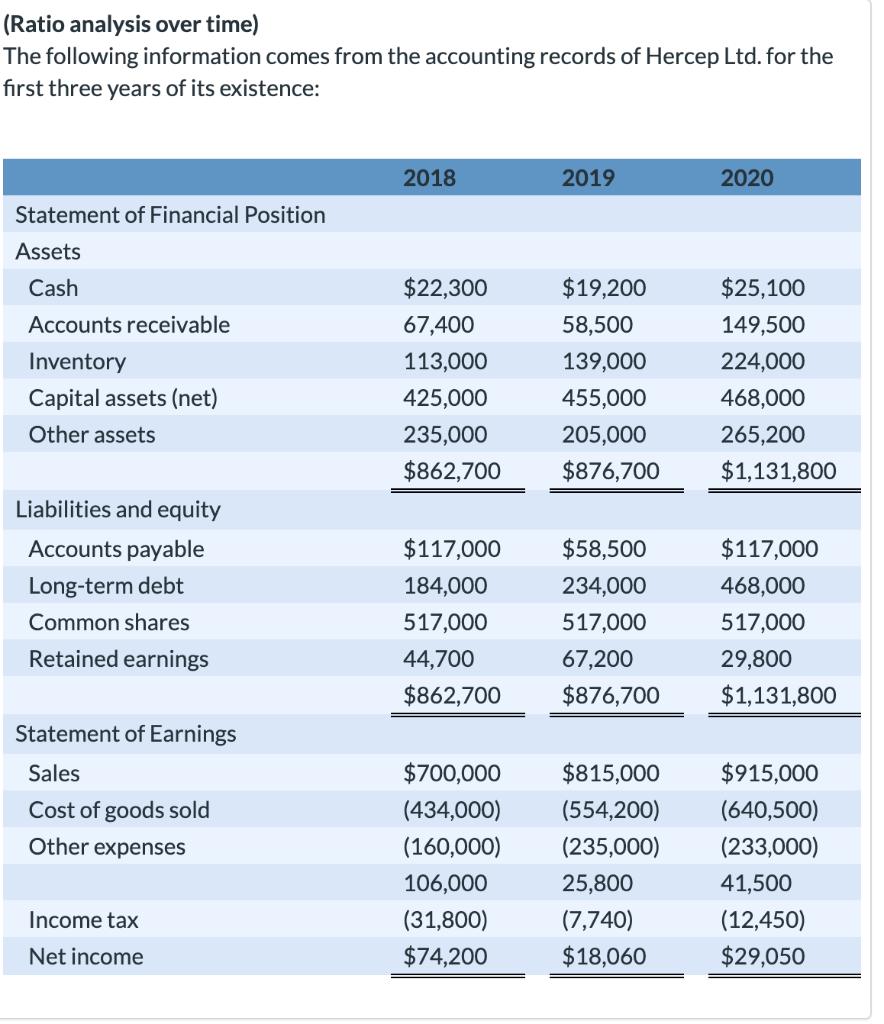
(Ratio analysis over time) The following information comes from the accounting records of Hercep Ltd. for the first three years of its existence: Statement of Financial Position Assets Cash Accounts receivable Inventory Capital assets (net) Other assets Liabilities and equity Accounts payable Long-term debt Common shares Retained earnings Statement of Earnings Sales Cost of goods sold Other expenses Income tax Net income 2018 $22,300 67,400 113,000 425,000 235,000 $862,700 $117,000 184,000 517,000 44,700 $862,700 2019 $19,200 58,500 139,000 455,000 205,000 $876,700 $58,500 234,000 517,000 67,200 $876,700 $700,000 $815,000 (434,000) (554,200) (160,000) (235,000) 106,000 25,800 (31,800) (7,740) $74,200 $18,060 2020 $25,100 149,500 224,000 468,000 265,200 $1,131,800 $117,000 468,000 517,000 29,800 $1,131,800 $915,000 (640,500) (233,000) 41,500 (12,450) $29,050
Step by Step Solution
★★★★★
3.40 Rating (153 Votes )
There are 3 Steps involved in it
Step: 1
SOLUTIONS 2018 2019 2020 Sales 100 100 100 Cost of goods sold 62 68 70 Gross margin 38 32 30 Other expenses 23 29 25 Income taxes 45 094 136 Net incom...
Get Instant Access to Expert-Tailored Solutions
See step-by-step solutions with expert insights and AI powered tools for academic success
Step: 2

Step: 3

Ace Your Homework with AI
Get the answers you need in no time with our AI-driven, step-by-step assistance
Get Started


