

Answered step by step
Verified Expert Solution
Question
1 Approved Answer
Based on above information regarding Cashflows: How much net cash from operations did each company generate last year? Which company has done a better job
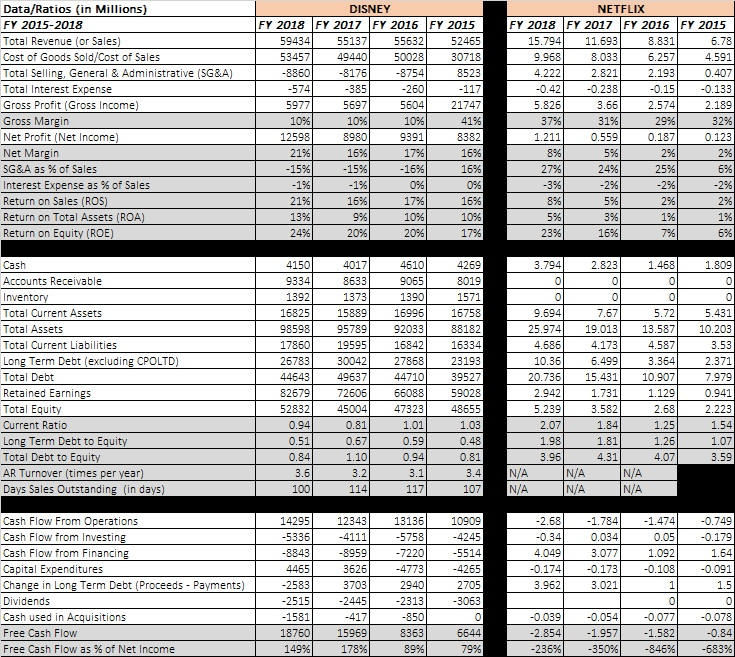
Based on above information regarding Cashflows:
- How much net cash from operations did each company generate last year?
- Which company has done a better job generating cash from operations?
- In layman's terms, how is each company spending their cash with respect to reinvestments in the business, changes in debt, and returning money to shareholders
-87541 5977 Data/Ratios (in Millions) FY 2015-2018 Total Revenue (or Sales) Cost of Goods Sold/Cost of Sales Total Selling, General & Administrative (SG&A) Total Interest Expense Gross Profit (Gross Income) Gross Margin Net Profit (Net Income) Net Margin SG&A as % of Sales Interest Expense as % of Sales Return on Sales (ROS) Return on Total Assets (ROA) Return on Equity (ROE) DISNEY FY 2018 FY 2017 FY 2016 FY 2015 59434 55137 55632 52465 53457 49440 50028 30718 -8860 -8176 8523 -385 -2600 -117 56971 5604 21747 10% 10% 41% 8980 8382 16% 16% -15% 16% 0% 16% 16% 9% 10% 20% 20% 17% NETFLIX FY 2018 FY 2017 FY 2016 FY 2015 15.794 11.693 8.831 6.78 9.968 8.033 6.257 4.591 4.222 2.821 2.193| 0.407 -0.42 -0.238 -0.15 -0.133 5.826 3.66 2.574 2.189 31% 29% 32% 1.211) 0.559 0.1871 0.123 894 5% 2% 27% 249 25% 6% -3% -2% 2% 3% 1% 23% 16% 37% 2% - 1% -295 -296 8% 596 295 1% 6% 3.794 2.823 1.468 1.809 4269 8019 1571 16758 88182 16334 23193 5.72 Cash Accounts Receivable Inventory Total Current Assets Total Assets Total Current Liabilities Long Term Debt (excluding CPOLTD) Total Debt Retained Earnings Total Equity Current Ratio Long Term Debt to Equity Total Debt to Equity AR Turnover (times per year) Days Sales Outstanding (in days) 4150 4017 9334 8633 1392 1373 16825 15889 0859895789 17860 19595 26783 30042 44643 49637 82679 72606 52832 45004 0.94 0.81 0.51 0.67 0.84 1.10 3.6 3.2 114 4610 9065 1390 16996 92033 16842 27868 447101 66088 47323 39527 9.694 7.67 25.974 19.013 13.587 4.686 4.173 4.587 10.36 6.499 3.364 20.736 15.431 10.907 2.9421 1.731 1.129 5.239 3.582 2.68 2.07 1.84 1.25 1.98 1.81 1.26 3.96 4.31 4.071 N/A N/A N/A N/A N/A N/A 5.431 10.203 3.53 2.371 7.979 0.941 2.223 1.54 1.07 359 59028 48655 1.03 0.48 0.81 3.4 107 1.01 0.59 0.94 100 117 12343 131361 -5758 -4111 Cash Flow From Operations Cash Flow from Investing Cash Flow from Financing Capital Expenditures Change in Long Term Debt (Proceeds - Payments) Dividends Cash used in Acquisitions Free Cash Flow Free Cash Flow as % of Net Income 142951 -5336 -8843 4465 -2583 -2515 -1581 18760 149% -0.749 -0.179 1.64 -0.091 -7220 -4773 2940 10909 -4245 -5514 -4265 2705 -3063 -2.68 -0.34 4.049 -0.174 3.962 -1.784 0.034 3.077 -0.173 3.021 -8959 3626 3703 -2445 -417 159691 178% 1.5 -1.474 0.05 1.092 -0.108 1 ol -0.0771 -1.582 -845% -2313 -850 8363 89% 6644 79% -0.039 -2.854 -236% -0.054 -1.957 -350% -0.078 -0.84 -583% -87541 5977 Data/Ratios (in Millions) FY 2015-2018 Total Revenue (or Sales) Cost of Goods Sold/Cost of Sales Total Selling, General & Administrative (SG&A) Total Interest Expense Gross Profit (Gross Income) Gross Margin Net Profit (Net Income) Net Margin SG&A as % of Sales Interest Expense as % of Sales Return on Sales (ROS) Return on Total Assets (ROA) Return on Equity (ROE) DISNEY FY 2018 FY 2017 FY 2016 FY 2015 59434 55137 55632 52465 53457 49440 50028 30718 -8860 -8176 8523 -385 -2600 -117 56971 5604 21747 10% 10% 41% 8980 8382 16% 16% -15% 16% 0% 16% 16% 9% 10% 20% 20% 17% NETFLIX FY 2018 FY 2017 FY 2016 FY 2015 15.794 11.693 8.831 6.78 9.968 8.033 6.257 4.591 4.222 2.821 2.193| 0.407 -0.42 -0.238 -0.15 -0.133 5.826 3.66 2.574 2.189 31% 29% 32% 1.211) 0.559 0.1871 0.123 894 5% 2% 27% 249 25% 6% -3% -2% 2% 3% 1% 23% 16% 37% 2% - 1% -295 -296 8% 596 295 1% 6% 3.794 2.823 1.468 1.809 4269 8019 1571 16758 88182 16334 23193 5.72 Cash Accounts Receivable Inventory Total Current Assets Total Assets Total Current Liabilities Long Term Debt (excluding CPOLTD) Total Debt Retained Earnings Total Equity Current Ratio Long Term Debt to Equity Total Debt to Equity AR Turnover (times per year) Days Sales Outstanding (in days) 4150 4017 9334 8633 1392 1373 16825 15889 0859895789 17860 19595 26783 30042 44643 49637 82679 72606 52832 45004 0.94 0.81 0.51 0.67 0.84 1.10 3.6 3.2 114 4610 9065 1390 16996 92033 16842 27868 447101 66088 47323 39527 9.694 7.67 25.974 19.013 13.587 4.686 4.173 4.587 10.36 6.499 3.364 20.736 15.431 10.907 2.9421 1.731 1.129 5.239 3.582 2.68 2.07 1.84 1.25 1.98 1.81 1.26 3.96 4.31 4.071 N/A N/A N/A N/A N/A N/A 5.431 10.203 3.53 2.371 7.979 0.941 2.223 1.54 1.07 359 59028 48655 1.03 0.48 0.81 3.4 107 1.01 0.59 0.94 100 117 12343 131361 -5758 -4111 Cash Flow From Operations Cash Flow from Investing Cash Flow from Financing Capital Expenditures Change in Long Term Debt (Proceeds - Payments) Dividends Cash used in Acquisitions Free Cash Flow Free Cash Flow as % of Net Income 142951 -5336 -8843 4465 -2583 -2515 -1581 18760 149% -0.749 -0.179 1.64 -0.091 -7220 -4773 2940 10909 -4245 -5514 -4265 2705 -3063 -2.68 -0.34 4.049 -0.174 3.962 -1.784 0.034 3.077 -0.173 3.021 -8959 3626 3703 -2445 -417 159691 178% 1.5 -1.474 0.05 1.092 -0.108 1 ol -0.0771 -1.582 -845% -2313 -850 8363 89% 6644 79% -0.039 -2.854 -236% -0.054 -1.957 -350% -0.078 -0.84 -583%
Step by Step Solution
There are 3 Steps involved in it
Step: 1

Get Instant Access to Expert-Tailored Solutions
See step-by-step solutions with expert insights and AI powered tools for academic success
Step: 2

Step: 3
Ace Your Homework with AI
Get the answers you need in no time with our AI-driven, step-by-step assistance
Get Started
Fintech In Islamic Finance Theory And Practice
Authors: Umar A. Oseni, S. Nazim Ali
1st Edition
1138494801, 978-1138494800