Based on all of the Information below, do you predict that U.S. Global Investors, Inc. company's stock will rise or fall in the succeeding week? Why?
Please share observations


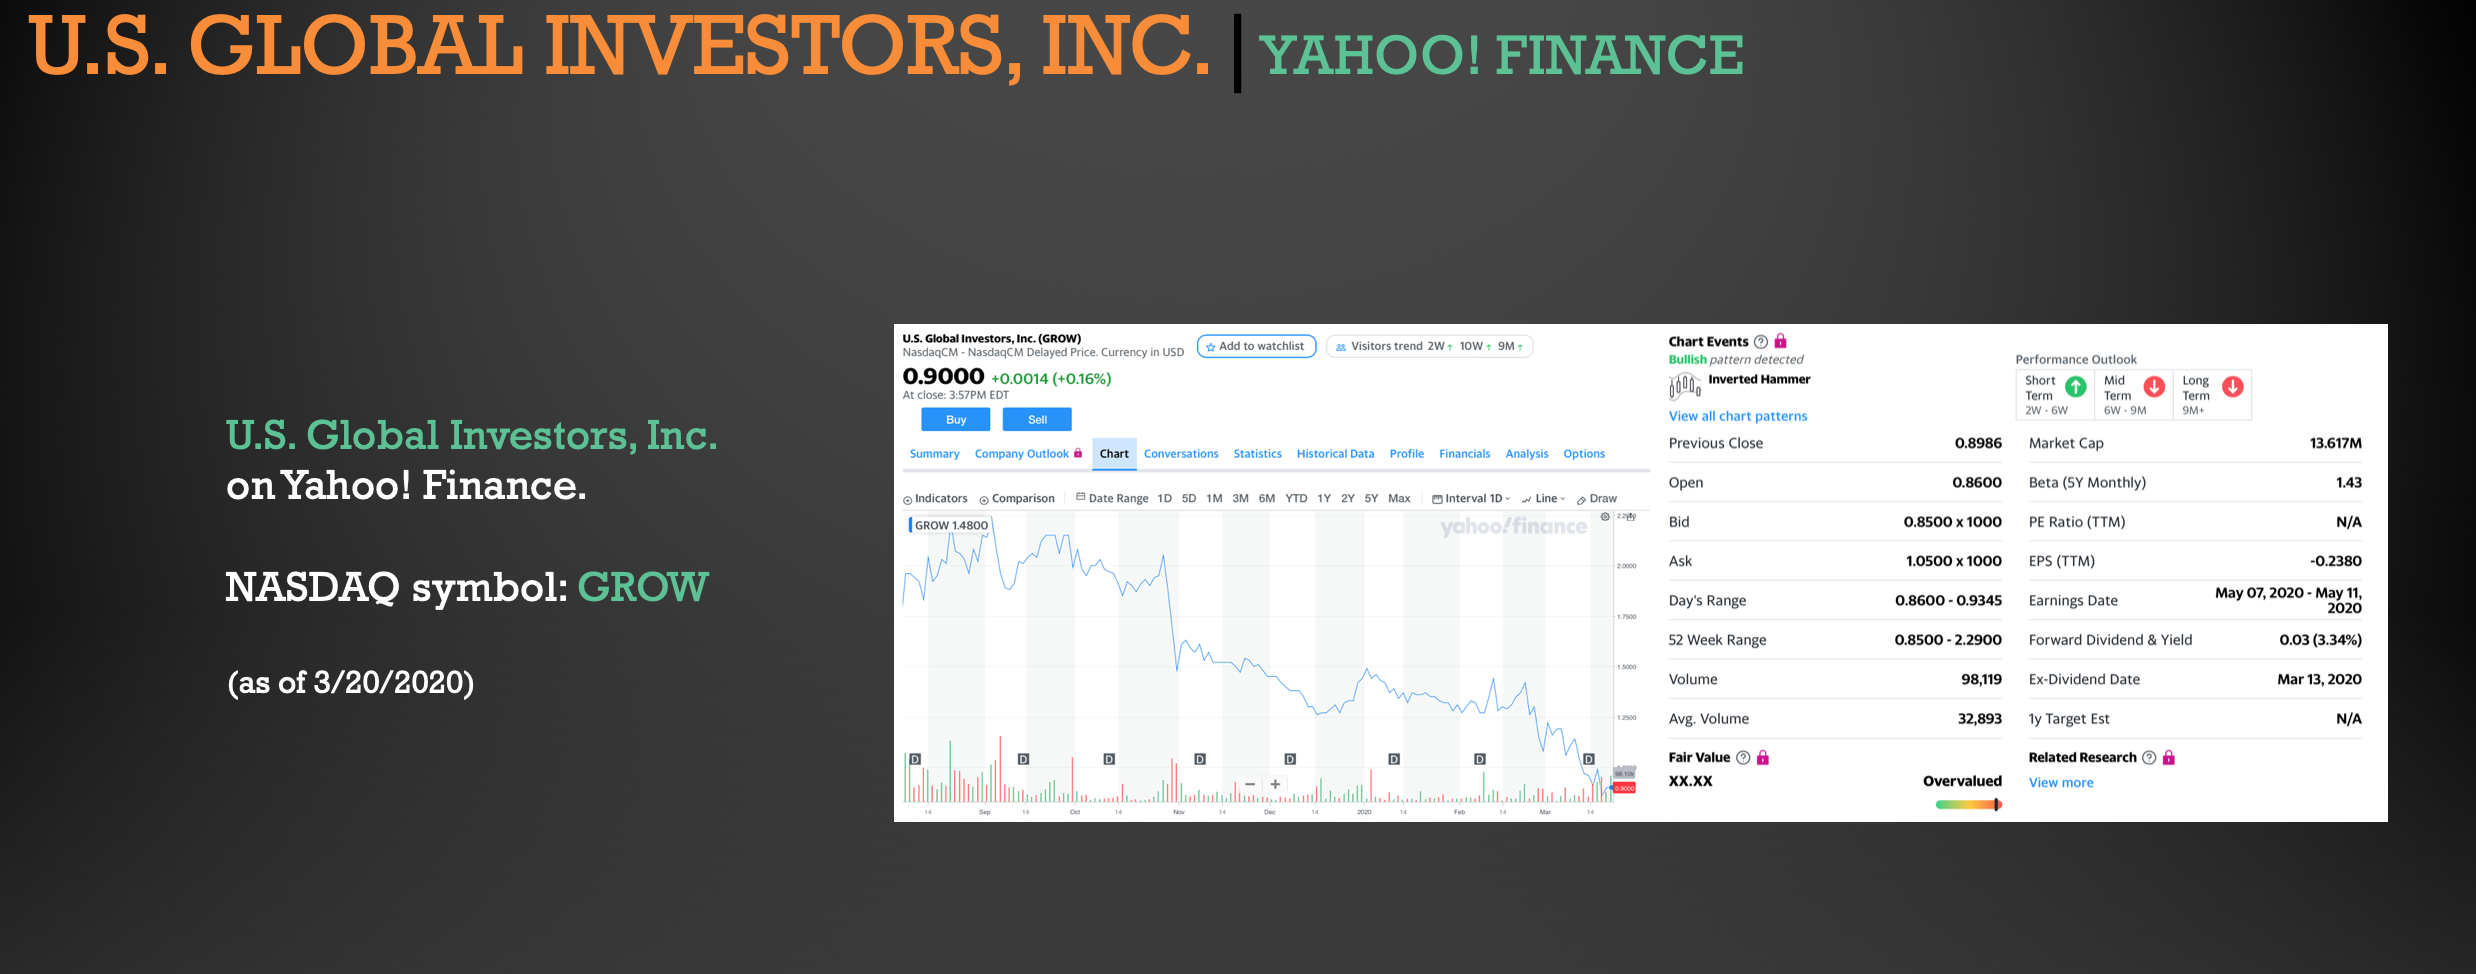
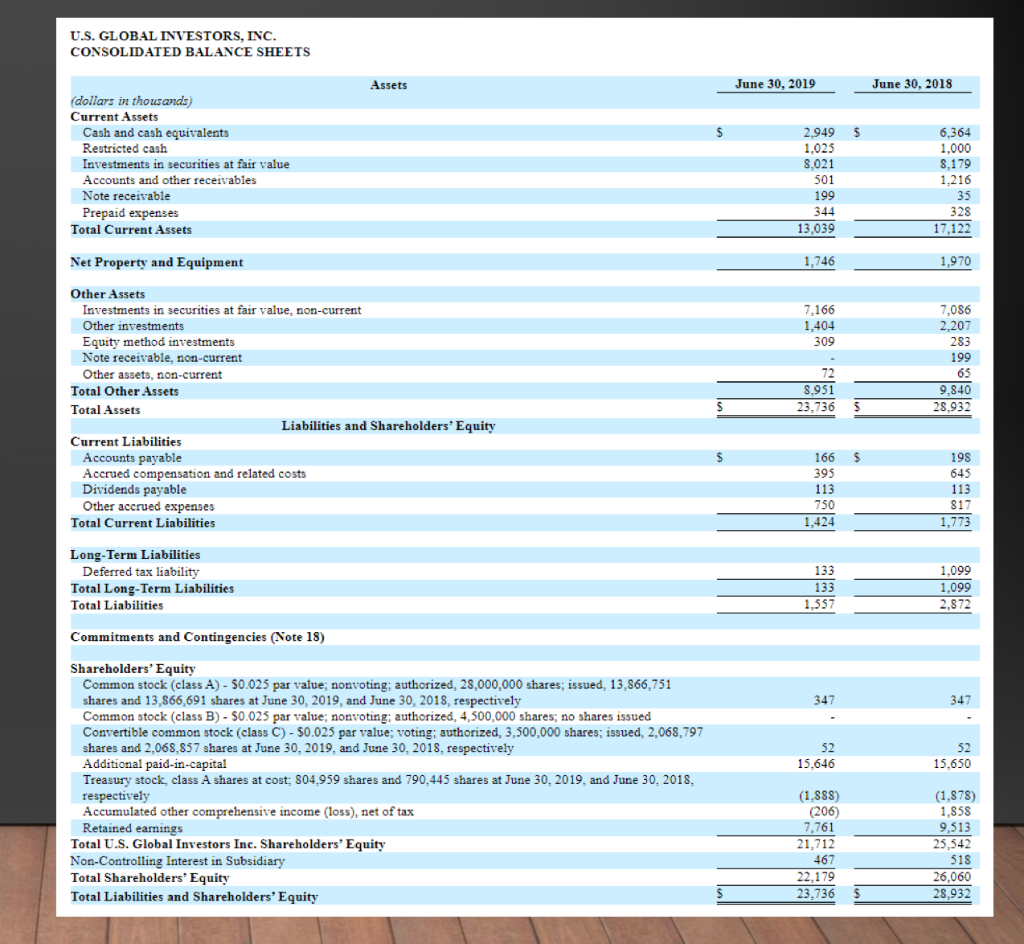
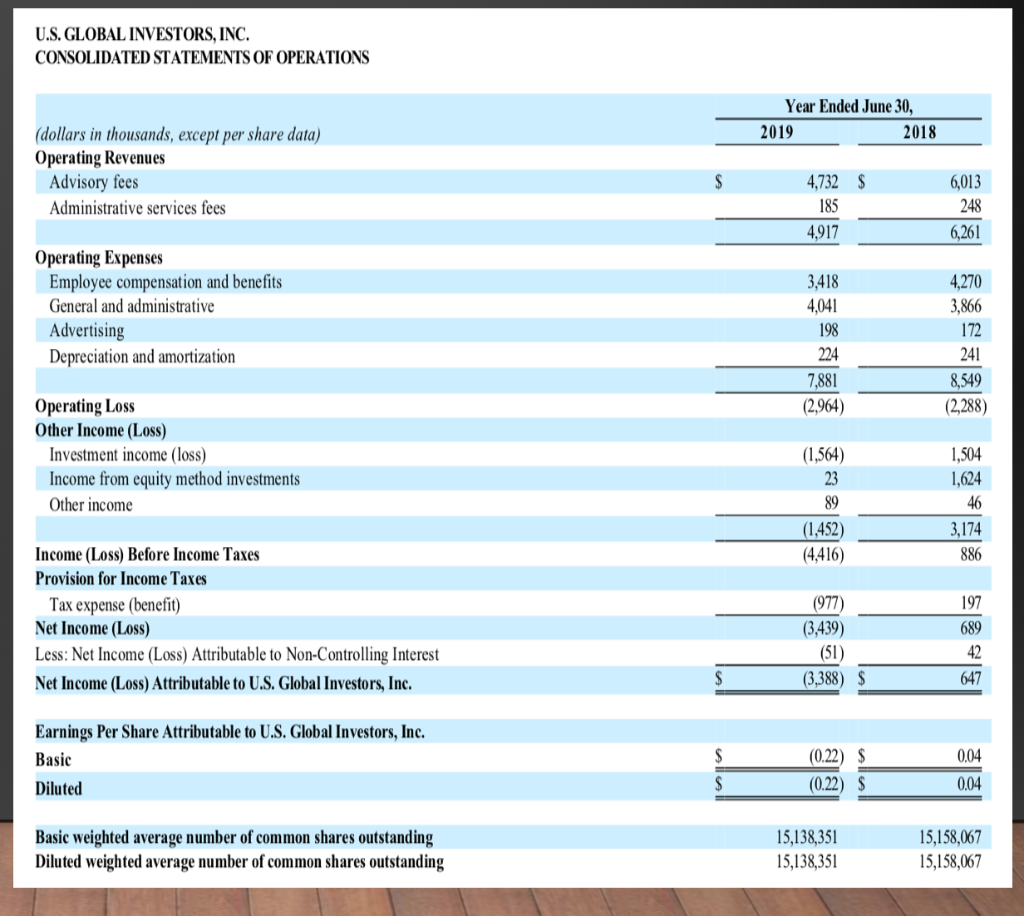
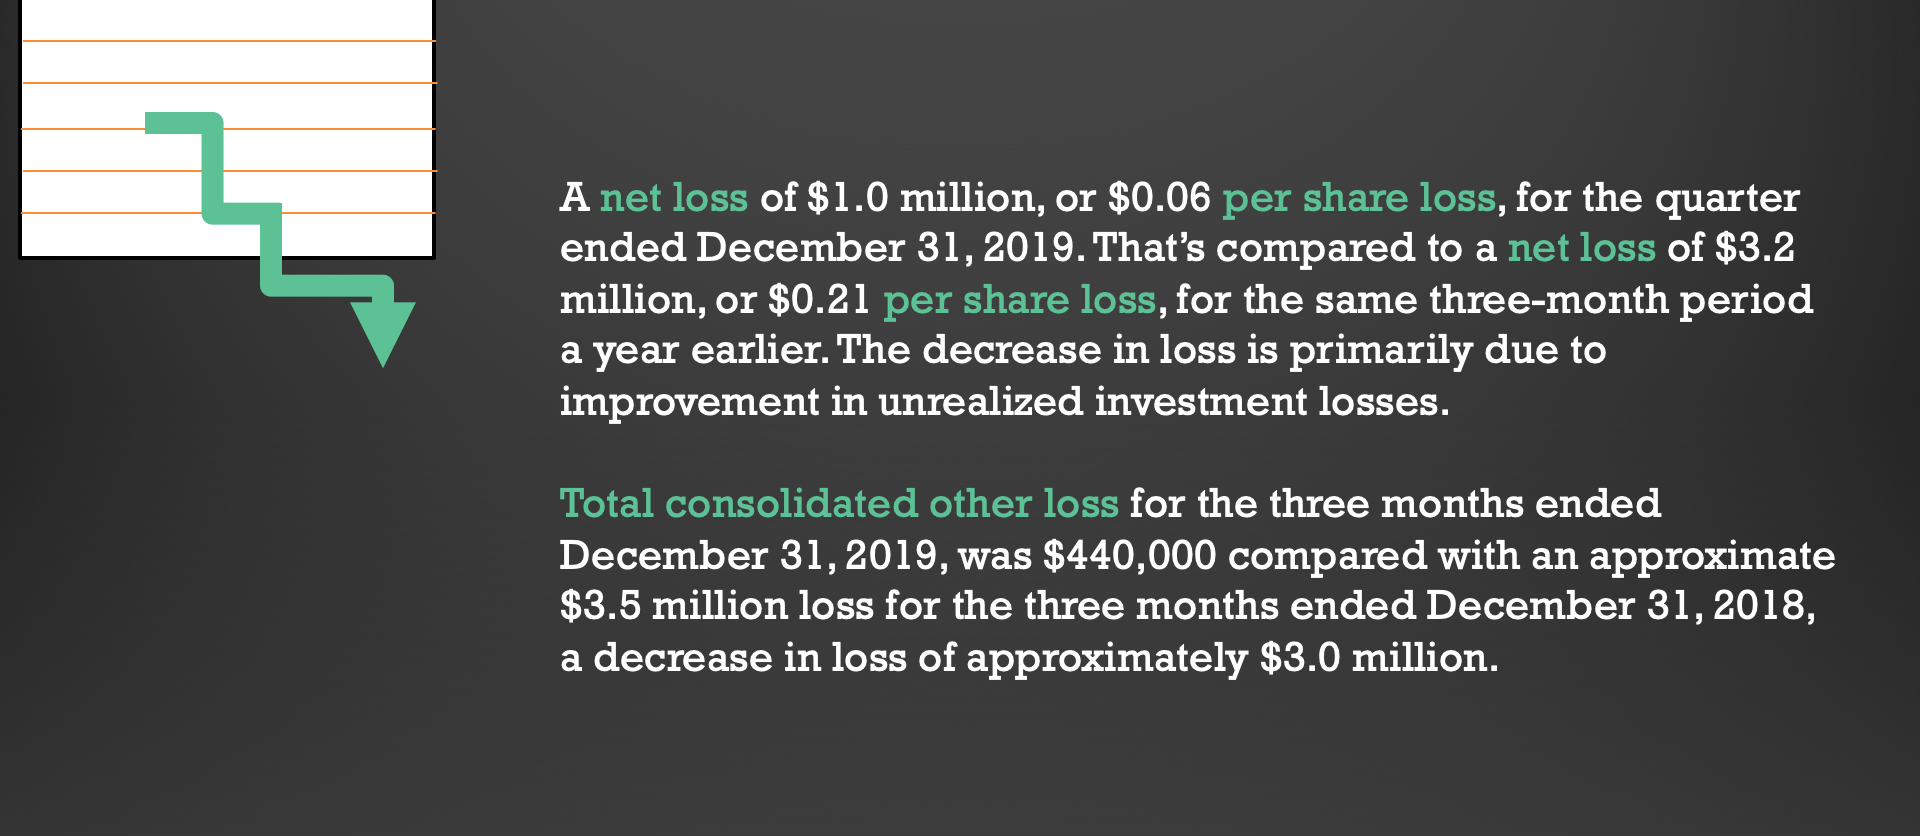
U.S. GLOBAL INVESTORS, INC. YAHOO! FINANCE U.S. Global Investors, Inc. (GROW) NasdaqCM - NasdaqCM Delayed Price. Currency in USD ( Add to watchlist) & Visitors trend 2W+10W + 9M Chart Events @ Bullish pattern detected on Inverted Hammer 0.9000 +0.0014 (+0.16%) At close: 3:57PM EDT Sell Performance Outlook Short Mid Term Term 2W - 6W 6W - 9M Long Term 9M Buy View all chart patterns Previous Close 0.8986 Market Cap 13.617M U.S. Global Investors, Inc. on Yahoo! Finance. Summary Company Outlook Chart Conversations Statistics Historical Data Profile Financials Analysis Options Open 0.8600 Beta (5Y Monthly) 1.43 Date Range 1D 5D 1M 3M 6M YTD 1Y 2Y 5Y Max Indicators Comparison GROW 1.4800 Interval 1D w Line Draw yahoo/finance Bid 0.8500 x 1000 PE Ratio (TTM) N/A Ask 1.0500 x 1000 EPS (TTM) -0.2380 NASDAQ symbol: GROW Day's Range 0.8600 -0.9345 Earnings Date May 07, 2020 - May 11, 2020 52 Week Range 0.8500 - 2.2900 Forward Dividend & Yield 0.03 (3.34%) (as of 3/20/2020) Volume 98,119 Ex-Dividend Date Mar 13, 2020 Avg. Volume 32,893 1y Target Est N/A & Fair Value XX.XX Related Research View more Overvalued U.S. GLOBAL INVESTORS, INC. CONSOLIDATED BALANCE SHEETS Assets June 30, 2019 June 30, 2018 S (dollars in thousands) Current Assets Cash and cash equivalents Restricted cash Investments in securities at fair value Accounts and other receivables Note receivable Prepaid expenses Total Current Assets 2,9495 1.025 8.021 501 199 344 13,039 6,364 1,000 8,179 1,216 35 328 17,122 Net Property and Equipment 1,746 1,970 7,166 1,404 309 Other Assets Investments in securities at fair value, non-current Other investments Equity method investments Note receivable, non-current Other assets, non-current Total Other Assets Total Assets Liabilities and Shareholders' Equity Current Liabilities Accounts payable Accrued compensation and related costs Dividends payable Other accrued expenses Total Current Liabilities 7,086 2,207 283 199 65 9840 28,932 8.951 S 23,736 $ $ 166 395 113 750 1,424 198 645 113 817 1,773 Long-Term Liabilities Deferred tax liability Total Long-Term Liabilities Total Liabilities 133 133 1,357 1,099 1,099 2.872 Commitments and Contingencies (Note 18) 347 347 52 15.646 15,650 Shareholders' Equity Common stock (class A) - $0.025 par value; nonvoting; authorized, 28,000,000 shares; issued, 13,866,751 shares and 13,866,691 shares at June 30, 2019, and June 30, 2018, respectively Common stock (class B) - $0.025 par value; nonvoting; authorized, 4,500,000 shares; no shares issued Convertible common stock (class C) - 50.025 par value; voting; authorized, 3,500,000 shares; issued, 2.068,797 shares and 2,068,857 shares at June 30, 2019, and June 30, 2018, respectively Additional paid-in-capital Treasury stock, class A shares at cost: 804,959 shares and 790,445 shares at June 30, 2019, and June 30, 2018, respectively Accumulated other comprehensive income (loss), net of tax Retained earnings Total U.S. Global Investors Inc. Shareholders' Equity Non-Controlling Interest in Subsidiary Total Shareholders' Equity Total Liabilities and Shareholders' Equity (1.888) (206) 7,761 21,712 467 22,179 23,736 (1,878) 1,858 9,513 25,542 518 26,060 28,932 $ $ U.S. GLOBAL INVESTORS, INC. CONSOLIDATED STATEMENTS OF OPERATIONS Year Ended June 30, 2019 2018 (dollars in thousands, except per share data) Operating Revenues Advisory fees Administrative services fees $ 6,013 4,732 185 4,917 248 6,261 Operating Expenses Employee compensation and benefits General and administrative Advertising Depreciation and amortization 3,418 4,041 4,270 3,866 172 198 224 241 7,881 (2,964) 8,549 (2,288) Operating Loss Other Income (Loss) Investment income (loss) Income from equity method investments Other income (1,564) 1,504 1,624 23 89 (1,452) (4,416) 46 3,174 886 Income (Loss) Before Income Taxes Provision for Income Taxes Tax expense (benefit) Net Income (Loss) Less: Net Income (Loss) Attributable to Non-Controlling Interest Net Income (Loss) Attributable to U.S. Global Investors, Inc. (977) (3,439) (51) (3,388) 047 Earnings Per Share Attributable to U.S. Global Investors, Inc. Basic Diluted 0.04 (0.22) $ (0.22) $ 0.04 Basic weighted average number of common shares outstanding Diluted weighted average number of common shares outstanding 15,138,351 15,138,351 15,158,067 15,158,067 U.S. GLOBAL INVESTORS, INC. CONSOLIDATED STATEMENTS OF COMPREHENSIVE INCOME (LOSS) (dollars in thousands) Year Ended June 30, 2019 2018 (3,388) $ $ 647 Net Income (Loss) Attributable to U.S. Global Investors, Inc. > Other Comprehensive Income (Loss), Net of Tax > Comprehensive Income (Loss) > Comprehensive Income (Loss) Attributable to U.S. Global Investors, Inc. Net Income (Loss) Attributable to U.S. Global Investors, Inc. Other Comprehensive Income (Loss), Net of Tax: Unrealized gains on available-for-sale securities arising during period Less: reclassification adjustment for gains/losses included in net income Net change from available-for-sale investments, net of tax? Foreign currency translation adjustment Reclassification of foreign currency losses on redemption of equity method investment to net income Other Comprehensive Income Comprehensive Income (Loss) Less: Comprehensive Loss Attributable to Non-Controlling Interest Comprehensive Income (Loss) Attributable to U.S. Global Investors, Inc. 2,297 (669) 1,628 (57) 15 1,586 2,233 25 (3,363) (8) (3,363) $ 2,241 A net loss of $1.0 million, or $0.06 per share loss, for the quarter ended December 31, 2019. That's compared to a net loss of $3.2 million, or $0.21 per share loss, for the same three-month period a year earlier. The decrease in loss is primarily due to improvement in unrealized investment losses. Total consolidated other loss for the three months ended December 31, 2019, was $440,000 compared with an approximate $3.5 million loss for the three months ended December 31, 2018, a decrease in loss of approximately $3.0 million


