

Answered step by step
Verified Expert Solution
Question
1 Approved Answer
Based on Caterpillar's (stock symbol: CAT) online annual financial statements Compute the EVAs, ROICs (for both years 2019 and 2020) and FCF. Pretending WACC is
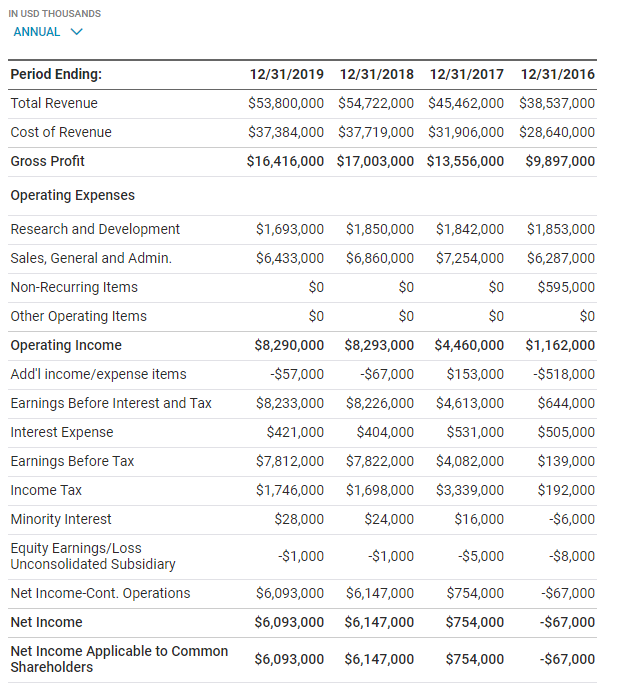
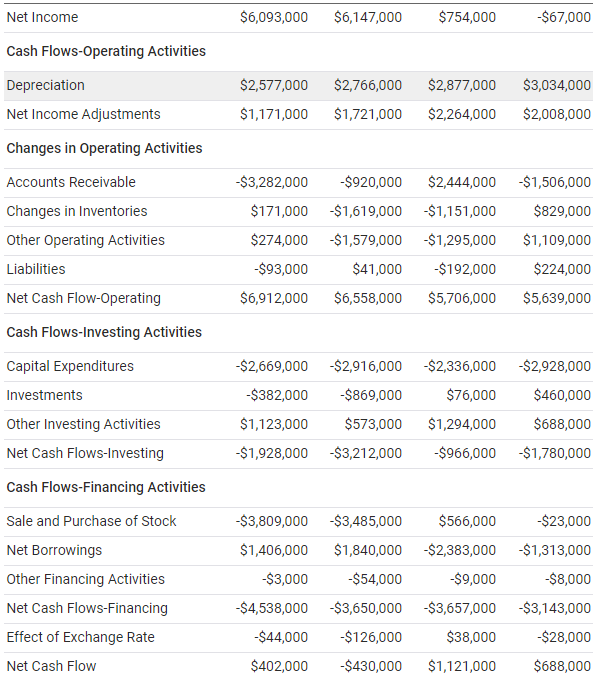
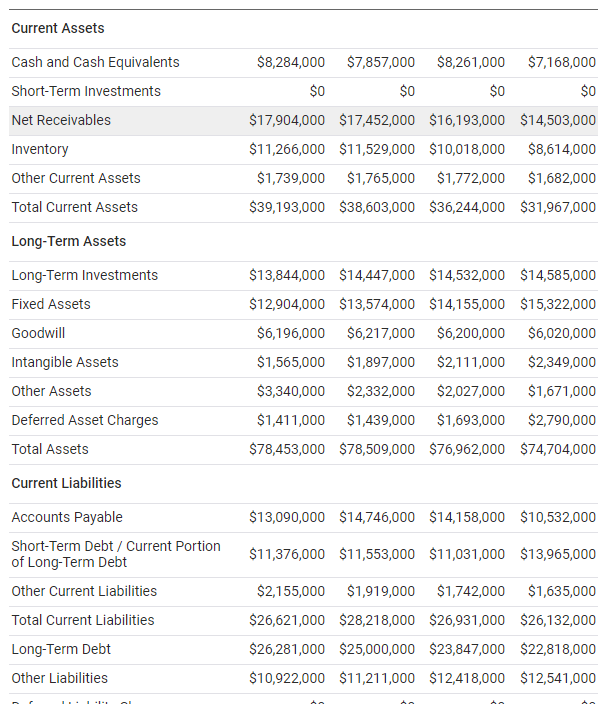
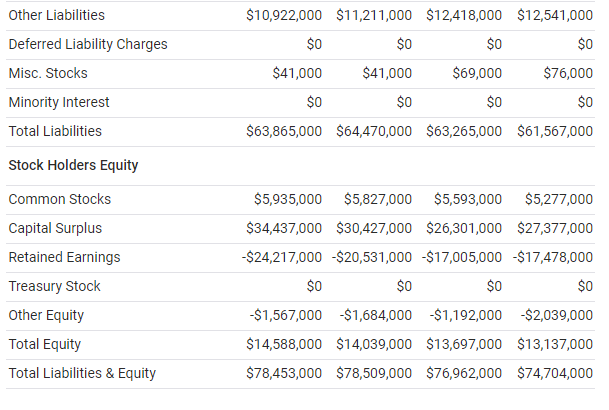
Based on Caterpillar's (stock symbol: CAT) online annual financial statements Compute the EVAs, ROICs (for both years 2019 and 2020) and FCF. Pretending WACC is given as 10% per year
IN USD THOUSANDS ANNUAL Period Ending: 12/31/2019 12/31/2018 12/31/2017 12/31/2016 Total Revenue Cost of Revenue Gross Profit $53,800,000 $54,722,000 $45,462,000 $38,537,000 $37,384,000 $37,719,000 $31,906,000 $28,640,000 $16,416,000 $17,003,000 $13,556,000 $9,897,000 $1,693,000 $1,850,000 $1,842,000 $1,853,000 $6,287,000 $595,000 $0 $1,162,000 $518,000 Operating Expenses Research and Development Sales, General and Admin. Non-Recurring Items Other Operating Items Operating Income Add'l income/expense items Earnings Before Interest and Tax Interest Expense Earnings Before Tax Income Tax Minority Interest Equity Earnings/Loss Unconsolidated Subsidiary Net Income-Cont. Operations Net Income $6,433,000 $6,860,000 $7,254,000 $0 $0 $0 $0 $0 $0 $8,290,000 $8,293,000 $4,460,000 -$57,000 -$67,000 $153,000 $8,233,000 $8,226,000 $4,613,000 $421,000 $404,000 $531,000 $7,812,000 $7,822,000 $4,082,000 $1,746,000 $1,698,000 $3,339,000 $28,000 $24,000 $16,000 $644,000 $505,000 $139,000 $192,000 -$6,000 -$1,000 -$1,000 -$5,000 -$8,000 $754,000 -$67,000 $6,093,000 $6,147,000 $6,093,000 $6,147,000 $754,000 -$67,000 Net Income Applicable to common Shareholders $6,093,000 $6,147,000 $754,000 -$67,000 Net Income $6,093,000 $6,147,000 $754,000 -$67,000 Cash Flows-Operating Activities Depreciation Net Income Adjustments $2,766,000 $2,877,000 $3,034,000 $2,577,000 $1,171,000 $1,721,000 $2,264,000 $2,008,000 Changes in Operating Activities $3,282,000 $920,000 $2,444,000 $1,506,000 $171,000 $1,619,000 $1,151,000 $829,000 $1,109,000 $1,295,000 $274,000 $1,579,000 -$93,000 $41,000 $192,000 $5,706,000 $224,000 $5,639,000 $6,912,000 $6,558,000 -$2,669,000 $2,916,000 -$2,928,000 -$2,336,000 $76,000 $382,000 $869,000 $460,000 Accounts Receivable Changes in Inventories Other Operating Activities Liabilities Net Cash Flow-Operating Cash Flows-Investing Activities Capital Expenditures Investments Other Investing Activities Net Cash Flows-Investing Cash Flows-Financing Activities Sale and Purchase of Stock Net Borrowings Other Financing Activities Net Cash Flows-Financing Effect of Exchange Rate Net Cash Flow $1,294,000 $688,000 $1,123,000 $573,000 -$1,928,000 $3,212,000 $966,000 -$1,780,000 $3,809,000 $3,485,000 $566,000 -$23,000 $1,406,000 $1,840,000 -$2,383,000 -$1,313,000 -$3,000 -$54,000 -$9,000 -$8,000 $3,650,000 -$3,657,000 -$4,538,000 -$44,000 $402,000 -$3,143,000 $28,000 $126,000 $38,000 -$430,000 $1,121,000 $688,000 Current Assets $8,284,000 $7,857,000 $8,261,000 $7,168,000 Cash and Cash Equivalents Short-Term Investments Net Receivables Inventory $0 $0 $0 $0 $17,904,000 $17,452,000 $16,193,000 $14,503,000 $11,266,000 $11,529,000 $10,018,000 $8,614,000 $1,739,000 $1,765,000 $1,772,000 $1,682,000 $39,193,000 $38,603,000 $36,244,000 $31,967,000 Other Current Assets Total Current Assets Long-Term Assets Long-Term Investments Fixed Assets Goodwill Intangible Assets Other Assets Deferred Asset Charges Total Assets $13,844,000 $14,447,000 $14,532,000 $14,585,000 $12,904,000 $13,574,000 $14,155,000 $15,322,000 $6,196,000 $6,217,000 $6,200,000 $6,020,000 $1,565,000 $1,897,000 $2,111,000 $2,349,000 $3,340,000 $2,332,000 $2,027,000 $1,671,000 $1,411,000 $1,439,000 $1,693,000 $2,790,000 $78,453,000 $78,509,000 $76,962,000 $74,704,000 Current Liabilities $13,090,000 $14,746,000 $14,158,000 $10,532,000 $11,376,000 $11,553,000 $11,031,000 $13,965,000 Accounts Payable Short-Term Debt / Current Portion of Long-Term Debt Other Current Liabilities Total Current Liabilities $2,155,000 $1,919,000 $1,742,000 $1,635,000 $26,621,000 $28,218,000 $26,931,000 $26,132,000 $26,281,000 $25,000,000 $23,847,000 $22,818,000 $10,922,000 $11,211,000 $12,418,000 $12,541,000 Long-Term Debt Other Liabilities Other Liabilities Deferred Liability Charges Misc. Stocks Minority Interest Total Liabilities $10,922,000 $11,211,000 $12,418,000 $12,541,000 $0 $0 $0 $0 $41,000 $41,000 $69,000 $76,000 $0 $0 $0 $0 $63,865,000 $64,470,000 $63,265,000 $61,567,000 Stock Holders Equity Common Stocks Capital Surplus Retained Earnings Treasury Stock Other Equity Total Equity Total Liabilities & Equity $5,935,000 $5,827,000 $5,593,000 $5,277,000 $34,437,000 $30,427,000 $26,301,000 $27,377,000 -$24,217,000 $20,531,000 -$17,005,000 $17,478,000 $0 $0 $0 $0 -$1,567,000 $1,684,000 $1,192,000 $2,039,000 $14,588,000 $14,039,000 $13,697,000 $13,137,000 $78,453,000 $78,509,000 $76,962,000 $74,704,000 IN USD THOUSANDS ANNUAL Period Ending: 12/31/2019 12/31/2018 12/31/2017 12/31/2016 Total Revenue Cost of Revenue Gross Profit $53,800,000 $54,722,000 $45,462,000 $38,537,000 $37,384,000 $37,719,000 $31,906,000 $28,640,000 $16,416,000 $17,003,000 $13,556,000 $9,897,000 $1,693,000 $1,850,000 $1,842,000 $1,853,000 $6,287,000 $595,000 $0 $1,162,000 $518,000 Operating Expenses Research and Development Sales, General and Admin. Non-Recurring Items Other Operating Items Operating Income Add'l income/expense items Earnings Before Interest and Tax Interest Expense Earnings Before Tax Income Tax Minority Interest Equity Earnings/Loss Unconsolidated Subsidiary Net Income-Cont. Operations Net Income $6,433,000 $6,860,000 $7,254,000 $0 $0 $0 $0 $0 $0 $8,290,000 $8,293,000 $4,460,000 -$57,000 -$67,000 $153,000 $8,233,000 $8,226,000 $4,613,000 $421,000 $404,000 $531,000 $7,812,000 $7,822,000 $4,082,000 $1,746,000 $1,698,000 $3,339,000 $28,000 $24,000 $16,000 $644,000 $505,000 $139,000 $192,000 -$6,000 -$1,000 -$1,000 -$5,000 -$8,000 $754,000 -$67,000 $6,093,000 $6,147,000 $6,093,000 $6,147,000 $754,000 -$67,000 Net Income Applicable to common Shareholders $6,093,000 $6,147,000 $754,000 -$67,000 Net Income $6,093,000 $6,147,000 $754,000 -$67,000 Cash Flows-Operating Activities Depreciation Net Income Adjustments $2,766,000 $2,877,000 $3,034,000 $2,577,000 $1,171,000 $1,721,000 $2,264,000 $2,008,000 Changes in Operating Activities $3,282,000 $920,000 $2,444,000 $1,506,000 $171,000 $1,619,000 $1,151,000 $829,000 $1,109,000 $1,295,000 $274,000 $1,579,000 -$93,000 $41,000 $192,000 $5,706,000 $224,000 $5,639,000 $6,912,000 $6,558,000 -$2,669,000 $2,916,000 -$2,928,000 -$2,336,000 $76,000 $382,000 $869,000 $460,000 Accounts Receivable Changes in Inventories Other Operating Activities Liabilities Net Cash Flow-Operating Cash Flows-Investing Activities Capital Expenditures Investments Other Investing Activities Net Cash Flows-Investing Cash Flows-Financing Activities Sale and Purchase of Stock Net Borrowings Other Financing Activities Net Cash Flows-Financing Effect of Exchange Rate Net Cash Flow $1,294,000 $688,000 $1,123,000 $573,000 -$1,928,000 $3,212,000 $966,000 -$1,780,000 $3,809,000 $3,485,000 $566,000 -$23,000 $1,406,000 $1,840,000 -$2,383,000 -$1,313,000 -$3,000 -$54,000 -$9,000 -$8,000 $3,650,000 -$3,657,000 -$4,538,000 -$44,000 $402,000 -$3,143,000 $28,000 $126,000 $38,000 -$430,000 $1,121,000 $688,000 Current Assets $8,284,000 $7,857,000 $8,261,000 $7,168,000 Cash and Cash Equivalents Short-Term Investments Net Receivables Inventory $0 $0 $0 $0 $17,904,000 $17,452,000 $16,193,000 $14,503,000 $11,266,000 $11,529,000 $10,018,000 $8,614,000 $1,739,000 $1,765,000 $1,772,000 $1,682,000 $39,193,000 $38,603,000 $36,244,000 $31,967,000 Other Current Assets Total Current Assets Long-Term Assets Long-Term Investments Fixed Assets Goodwill Intangible Assets Other Assets Deferred Asset Charges Total Assets $13,844,000 $14,447,000 $14,532,000 $14,585,000 $12,904,000 $13,574,000 $14,155,000 $15,322,000 $6,196,000 $6,217,000 $6,200,000 $6,020,000 $1,565,000 $1,897,000 $2,111,000 $2,349,000 $3,340,000 $2,332,000 $2,027,000 $1,671,000 $1,411,000 $1,439,000 $1,693,000 $2,790,000 $78,453,000 $78,509,000 $76,962,000 $74,704,000 Current Liabilities $13,090,000 $14,746,000 $14,158,000 $10,532,000 $11,376,000 $11,553,000 $11,031,000 $13,965,000 Accounts Payable Short-Term Debt / Current Portion of Long-Term Debt Other Current Liabilities Total Current Liabilities $2,155,000 $1,919,000 $1,742,000 $1,635,000 $26,621,000 $28,218,000 $26,931,000 $26,132,000 $26,281,000 $25,000,000 $23,847,000 $22,818,000 $10,922,000 $11,211,000 $12,418,000 $12,541,000 Long-Term Debt Other Liabilities Other Liabilities Deferred Liability Charges Misc. Stocks Minority Interest Total Liabilities $10,922,000 $11,211,000 $12,418,000 $12,541,000 $0 $0 $0 $0 $41,000 $41,000 $69,000 $76,000 $0 $0 $0 $0 $63,865,000 $64,470,000 $63,265,000 $61,567,000 Stock Holders Equity Common Stocks Capital Surplus Retained Earnings Treasury Stock Other Equity Total Equity Total Liabilities & Equity $5,935,000 $5,827,000 $5,593,000 $5,277,000 $34,437,000 $30,427,000 $26,301,000 $27,377,000 -$24,217,000 $20,531,000 -$17,005,000 $17,478,000 $0 $0 $0 $0 -$1,567,000 $1,684,000 $1,192,000 $2,039,000 $14,588,000 $14,039,000 $13,697,000 $13,137,000 $78,453,000 $78,509,000 $76,962,000 $74,704,000Step by Step Solution
There are 3 Steps involved in it
Step: 1

Get Instant Access to Expert-Tailored Solutions
See step-by-step solutions with expert insights and AI powered tools for academic success
Step: 2

Step: 3
Ace Your Homework with AI
Get the answers you need in no time with our AI-driven, step-by-step assistance
Get Started
Financial Services Sales Handbook A Professionals Guide To Becoming A Top Producer
Authors: Clifton T. Warren
1st Edition
1631574930, 978-1631574931