

Answered step by step
Verified Expert Solution
Question
1 Approved Answer
Based on Exhibit 10 and 11, calculate the following metrics for Apple, Samsung and Blackberry: 1) Inventory Turnover Ratio, 2) Days Inventory, and 3) ROA.
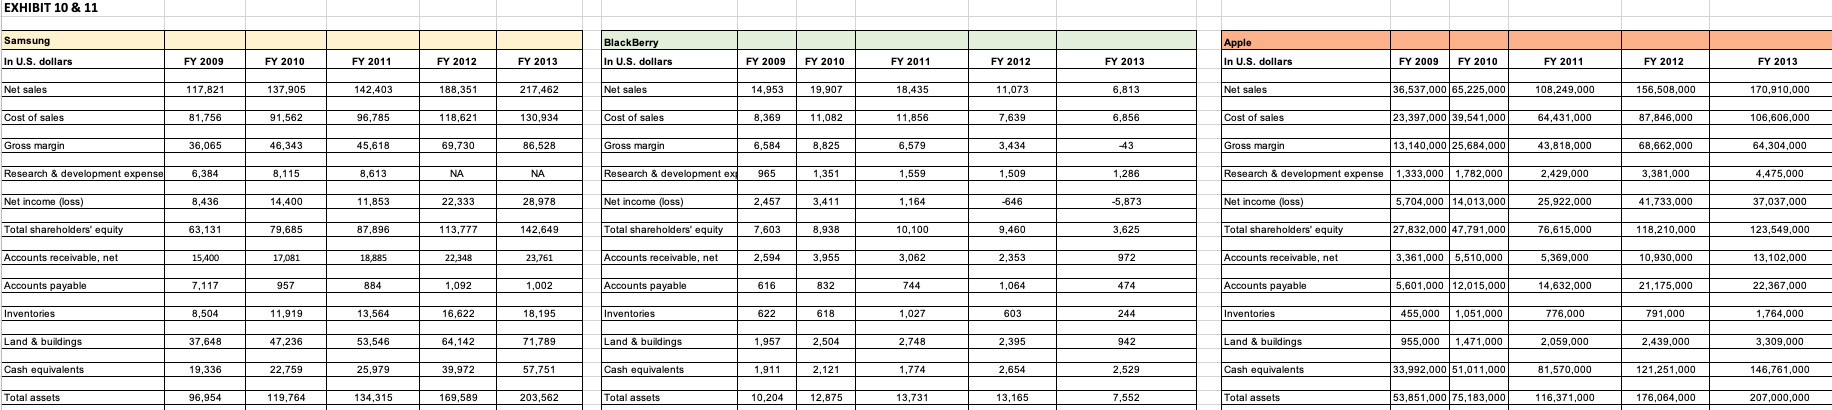
Based on Exhibit 10 and 11, calculate the following metrics for Apple, Samsung and Blackberry: 1) Inventory Turnover Ratio, 2) Days Inventory, and 3) ROA.
\begin{tabular}{|l|c|c|c|c|c|} \hline Samsung & & & & & \\ \hline In U.S. dollars & FY2009 & FY2010 & FY2011 & FY2012 & FY2013 \\ \hline Net sales & 117,821 & 137,905 & 142,403 & 188,351 & 217,462 \\ \hline Cost of sales & 81,756 & 91,562 & 96,785 & 118,621 & 130,934 \\ \hline Gross margin & 36,065 & 46,343 & 45,618 & 69,730 & 86,528 \\ \hline Research \& development expense & 6,384 & 8,115 & 8,613 & NA & NA \\ \hline Net income (lioss) & 8,436 & 14,400 & 11,853 & 22,333 & 28,978 \\ \hline Total shareholders' equity & 63,131 & 79,685 & 87,896 & 113,777 & 142,649 \\ \hline Accounts receivable, net & 15,400 & 17,081 & 18,885 & 22,348 & 23,761 \\ \hline Accounts payable & 7,117 & 957 & 884 & 1,092 & 1,002 \\ \hline Inventories & 8,504 & 11,919 & 13,564 & 16,622 & 18,195 \\ \hline Land \& buildings & 37,648 & 47,236 & 53,546 & 64,142 & 71,789 \\ \hline Cash equivalents & 19,336 & 22,759 & 25,979 & 39,972 & 57,751 \\ \hline Total assets & 96,954 & 119,764 & 134,315 & 169,589 & 203,562 \\ \hline \end{tabular}Step by Step Solution
There are 3 Steps involved in it
Step: 1

Get Instant Access to Expert-Tailored Solutions
See step-by-step solutions with expert insights and AI powered tools for academic success
Step: 2

Step: 3
Ace Your Homework with AI
Get the answers you need in no time with our AI-driven, step-by-step assistance
Get Started
Audit Of The Management Of Federal Prison Industries And Efforts To Create Work Opportunities For Federal Inmates
Authors: U.S. Department Of Justice
1st Edition
1500770442, 978-1500770440