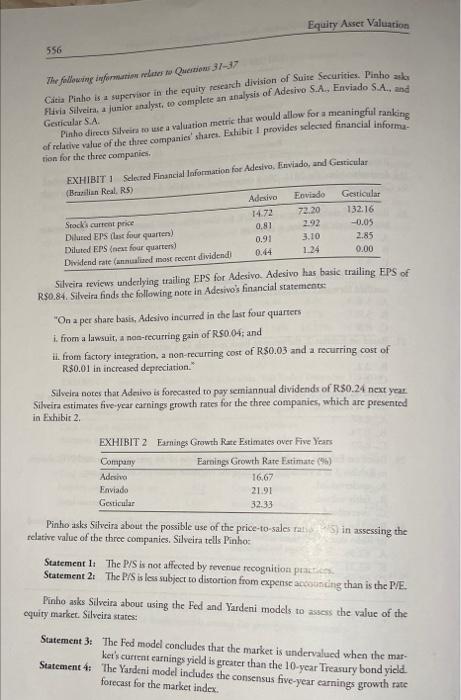
Based on Exhibits 1 and 2, which company's shares are the most attractively priced based on the five-year forward P/E-to-growth ratio (PEG)?
Equity Asset Valuation 556 The following terminares Questions 31-37 Catia Pinho is a supervisor in the equity research division of Suite Securities. Pinho acha Flvia Silveira, a jumlor analyst to complete an analysis of Adesivo S.A. Enviado S.A. and Gesticular SA Pinho directs Silveira o use a valuation metric that would allow for a meaningful ranking of relative value of the three companies' share. Exhibit I provides selected financial informe tion for the three companies EXHIBIT 1 Scenied Financial Information for Adesivo Enviado, and Gesticular (Brazilian Real RS) Adesivo Enviado Gesticular Stocks current price 14.72 72.20 132.16 Diluted EPS (las four quarten) 0.81 2.92 -0.05 Diluted EPS (next four quarten) 0.91 3.10 2.85 Dividend rate (mmulined inost recent dividendi 0.44 1.24 0.00 Silveira reviews underlying trailing EPS for Adesivo Adesivo has basic trailing EPS of R$0.84. Silveira finds the following note in Adesivo's financial statements "On a per share basis. Adesivo incurred in the last four quarters i. from a lawsuit, a nos-recurring gain of R$0.04; and ii. from factory integration, a non-recurring cost of R$0.03 and a recurring cost of R$0.01 in increased depreciation." Silveira notes that Adesivo is forecasted to pay semiannual dividends of R80.24 next year. Silveira estimates five-year carnings growth rates for the three companies, which are presented in Exhibit 2 EXHIBIT 2 Earnings Growth Rate Estimates over Five Years Company Earnings Growth Rate Estimate (6) Adesivo 16,67 Enviado 21.91 Gesticular 32.33 Pinho asks Silveira about the possible use of the price-to-sales a, 5) in assessing the relative value of the three companies. Silveita tells Pinhos Statement I: The P/S is not affected by revenue recognition par Statement 2: The P/S is less subject to distortion from expense accouncing than is the PE- Pinho asks Silveira about using the Fed and Yandeni models to assess the value of the equity market. Silveira states: Statement 3: The Fed model concludes that the market is undervalued when the mar- ker's current earnings yield is greater than the 10-year Treasury bond yield. Statement 4: The Yandeni model includes the consensus five-year earnings growth rate forecast for the market index Silveira also analyzes the three companies using the enterprising value (EV)-to-EBITDA million and gathers other selected information on Gesticular, which is presented in Exhibit 4. Silveira notes that the EBITDA for Gesticular for the most recent year is R$560 multiple Market Value of Debt EXHIBIT 4 Selected Information on Gesticular at Year-End (R$ millions) Market Value of Market Value of Short-Term Common Equity Preferred Equity Cash Investments 6,766 275 581 495 1,733 Pinho asks Silveira about the use of momentum indicators in assessing the shares of the three companies. Silveira states: Statement 5: Relative-strength indicators compare an equity's performance during a period with the performance of some group of equities or its own past performance. Statement 6: In the calculation of standardized unexpected earnings (SUE), the magni- tude of unexpected earnings is typically scaled by the standard deviation of analyses' earnings forecasts. 21 Rannd. D


