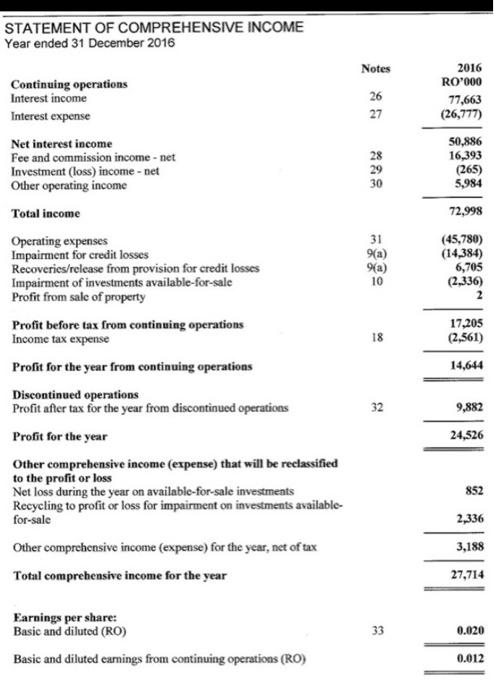
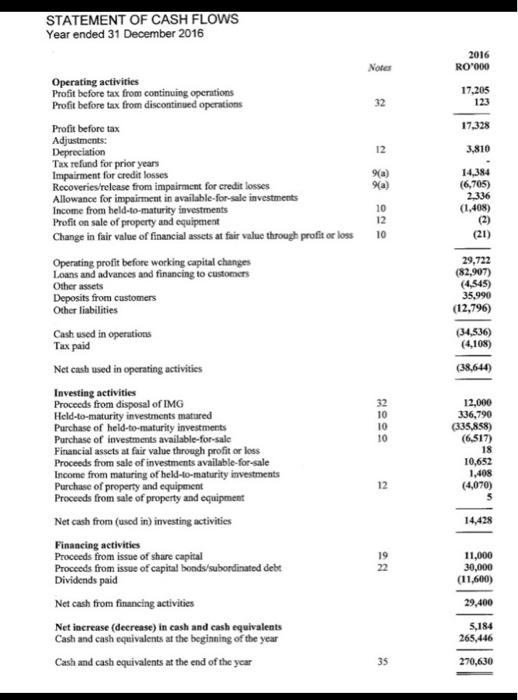
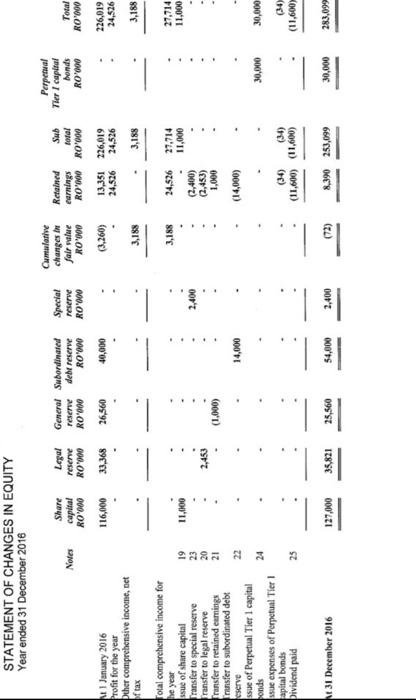
Based on financial reports prepare ratio analysis and interpret the result of the Following ratios:
1)Liquidity : Current Ratio, Quick Ratio
2(Leverage : Debt to Total Assets Ratio, Debt to Equity Ratio
3)Profitability : Based on Sales, Based on Investment and based on Market Ratios
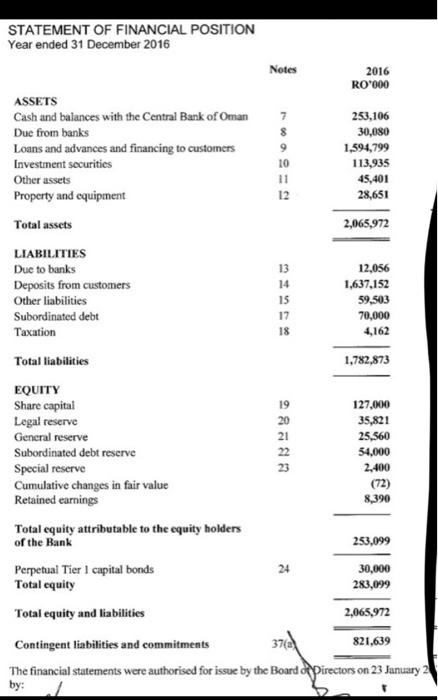
STATEMENT OF FINANCIAL POSITION Year ended 31 December 2016 Notes 2016 RO'000 8 253,106 30,080 1,594,799 113,935 45,401 28,651 10 12 ASSETS Cash and balances with the Central Bank of Oman Due from banks Loans and advances and financing to customers Investment securities Other assets Property and equipment Total assets LIABILITIES Due to banks Deposits from customers Other liabilities Subordinated debt Taxation 2,065,972 13 15 17 18 12,056 1,637,152 59,503 70,000 4,162 Total liabilities 1,782,873 EQUITY Share capital 19 127.000 Legal reserve 20 35,821 General reserve 21 25,560 Subordinated debt reserve 22 54,000 Special reserve 23 2,400 Cumulative changes in fair value (72) Retained earnings 8,390 Total equity attributable to the equity holders of the Bank 253,099 Perpetual Tier I capital bonds 30,000 Total equity 283,099 Total equity and liabilities 2,065,972 Contingent liabilities and commitments 372 821,639 The financial statements were authorised for issue by the Board of Directors on 23 January 2 24 by: STATEMENT OF COMPREHENSIVE INCOME Year ended 31 December 2016 Notes 26 27 2016 RO'000 77,663 (26,777) 28 29 30 50,886 16,393 (265) 5,984 72,998 31 9(a) 9a) 10 (45,780) (14,384) 6,705 (2.336) 2 Continuing operations Interest income Interest expense Net interest income Fee and commission income-net Investment (loss) income - net Other operating income Total income Operating expenses Impairment for credit losses Recoveries/release from provision for credit losses Impairment of investments available-for-sale Profit from sale of property Profit before tax from continuing operations Income tax expense Profit for the year from continuing operations Discontinued operations Profit after tax for the year from discontinued operations Profit for the year Other comprehensive income (expense) that will be reclassified to the profit or loss Net loss during the year on available-for-sale investments Recycling to profit or loss for impairment on investments available- for-sale Other comprehensive income (expense) for the year, net of tax Total comprehensive income for the year 18 17,205 (2,561) 14,644 32 9,882 24,526 852 2,336 3,188 27,714 33 0.020 Earnings per share: Basic and diluted (RO) Basic and diluted earnings from continuing operations (RO) 0.012 STATEMENT OF CASH FLOWS Year ended 31 December 2016 2016 ROM) 17,205 123 17,328 3,810 14,384 (6,705) 2,336 (1,408) (2) (21) 29,722 (82,907) (4,545) 35,990 (12,796) (34,536) (4,108) Notes Operating activities Profit before tax from continuing operations Profit before tax from discontinued operations 32 Profit before tax Adjustments: Depreciation 12 Tax refund for prior years Impairment for credit losses 9a) Recoveries/release from impairment for credit losses 9a Allowance for impairment in available-for-sale investments Income from held-to-maturity investments 10 Profit on sale of property and equipment 12 Change in fair value of financial assets at fair value through profit or loss 10 Operating profit before working capital changes Loans and advances and financing to customers Other assets Deposits from customers Other liabilities Cash used in operations Tax paid Net cash used in operating activities Investing activities Proceeds from disposal of IMG 32 Held-to-maturity investments matured 10 Purchase of held-to-maturity investments 10 Purchase of investments available for sale 10 Financial assets at fair value through profit or loss Proceeds from sale of investments available-for-sale Income from maturing of held-to-maturity investments Purchase of property and equipment 12 Proceeds from sale of property and equipment Net cash from (used in) investing activities Financing activities Proceeds from issue of share capital 19 Proceeds from issue of capital bonds'subordinated debt 22 Dividends paid Net cash from financing activities Net increase (decrease) in cash and cash equivalents Cash and cash equivalents at the beginning of the year Cash and cash equivalents at the end of the year 35 12,000 336,790 (335.858) (6.517) 18 10,652 1,408 (4,070) 5 14,428 11,000 30,000 (11,600) 29.400 5,184 265,446 270,630 STATEMENT OF CHANGES IN EQUITY Year ended 31 December 2016 Share capital R0000 Legal reserve ROVO Notes General Subordinated reserve debt reserve R000 RO'000 26,560 40,000 Cumulative changes fair value k0'000 Special reserve Robot Perpetual Tier I capital donds 20' Retained Sub carmings forel RO 00 RO 000 13,351 226,019 24,526 24,526 Total R0'000 116,000 33,368 (1,260) 11 January 2016 Profit for the year Other comprehensive income, net 226,019 24,526 3,188 f tax 3,188 3,188 3,188 27,714 11,000 11,000 19 23 20 2,400 24,526 27,714 11,000 (2,400) (2,453) 1,000 2,453 (1.000) Total comprehensive income for he year ssue of share capital Transfer to special reserve ransfer to legal reserve Transfer to retained cumings nsfer to subordinated debt eserve ssue of Perpetual Tier I capital ponds we expenses of Perpetual Tier apital bonds Dividend paid 22 14,000 (14,000) 24 30,000 30,000 (34) 25 (34) (34) (11,600) (11,600) (11,600) la l. At 31 December 2016 127,000 35,821 25,560 54,000 2,400 8,990 253,099 30,000 283,097 STATEMENT OF FINANCIAL POSITION Year ended 31 December 2016 Notes 2016 RO'000 8 253,106 30,080 1,594,799 113,935 45,401 28,651 10 12 ASSETS Cash and balances with the Central Bank of Oman Due from banks Loans and advances and financing to customers Investment securities Other assets Property and equipment Total assets LIABILITIES Due to banks Deposits from customers Other liabilities Subordinated debt Taxation 2,065,972 13 15 17 18 12,056 1,637,152 59,503 70,000 4,162 Total liabilities 1,782,873 EQUITY Share capital 19 127.000 Legal reserve 20 35,821 General reserve 21 25,560 Subordinated debt reserve 22 54,000 Special reserve 23 2,400 Cumulative changes in fair value (72) Retained earnings 8,390 Total equity attributable to the equity holders of the Bank 253,099 Perpetual Tier I capital bonds 30,000 Total equity 283,099 Total equity and liabilities 2,065,972 Contingent liabilities and commitments 372 821,639 The financial statements were authorised for issue by the Board of Directors on 23 January 2 24 by: STATEMENT OF COMPREHENSIVE INCOME Year ended 31 December 2016 Notes 26 27 2016 RO'000 77,663 (26,777) 28 29 30 50,886 16,393 (265) 5,984 72,998 31 9(a) 9a) 10 (45,780) (14,384) 6,705 (2.336) 2 Continuing operations Interest income Interest expense Net interest income Fee and commission income-net Investment (loss) income - net Other operating income Total income Operating expenses Impairment for credit losses Recoveries/release from provision for credit losses Impairment of investments available-for-sale Profit from sale of property Profit before tax from continuing operations Income tax expense Profit for the year from continuing operations Discontinued operations Profit after tax for the year from discontinued operations Profit for the year Other comprehensive income (expense) that will be reclassified to the profit or loss Net loss during the year on available-for-sale investments Recycling to profit or loss for impairment on investments available- for-sale Other comprehensive income (expense) for the year, net of tax Total comprehensive income for the year 18 17,205 (2,561) 14,644 32 9,882 24,526 852 2,336 3,188 27,714 33 0.020 Earnings per share: Basic and diluted (RO) Basic and diluted earnings from continuing operations (RO) 0.012 STATEMENT OF CASH FLOWS Year ended 31 December 2016 2016 ROM) 17,205 123 17,328 3,810 14,384 (6,705) 2,336 (1,408) (2) (21) 29,722 (82,907) (4,545) 35,990 (12,796) (34,536) (4,108) Notes Operating activities Profit before tax from continuing operations Profit before tax from discontinued operations 32 Profit before tax Adjustments: Depreciation 12 Tax refund for prior years Impairment for credit losses 9a) Recoveries/release from impairment for credit losses 9a Allowance for impairment in available-for-sale investments Income from held-to-maturity investments 10 Profit on sale of property and equipment 12 Change in fair value of financial assets at fair value through profit or loss 10 Operating profit before working capital changes Loans and advances and financing to customers Other assets Deposits from customers Other liabilities Cash used in operations Tax paid Net cash used in operating activities Investing activities Proceeds from disposal of IMG 32 Held-to-maturity investments matured 10 Purchase of held-to-maturity investments 10 Purchase of investments available for sale 10 Financial assets at fair value through profit or loss Proceeds from sale of investments available-for-sale Income from maturing of held-to-maturity investments Purchase of property and equipment 12 Proceeds from sale of property and equipment Net cash from (used in) investing activities Financing activities Proceeds from issue of share capital 19 Proceeds from issue of capital bonds'subordinated debt 22 Dividends paid Net cash from financing activities Net increase (decrease) in cash and cash equivalents Cash and cash equivalents at the beginning of the year Cash and cash equivalents at the end of the year 35 12,000 336,790 (335.858) (6.517) 18 10,652 1,408 (4,070) 5 14,428 11,000 30,000 (11,600) 29.400 5,184 265,446 270,630 STATEMENT OF CHANGES IN EQUITY Year ended 31 December 2016 Share capital R0000 Legal reserve ROVO Notes General Subordinated reserve debt reserve R000 RO'000 26,560 40,000 Cumulative changes fair value k0'000 Special reserve Robot Perpetual Tier I capital donds 20' Retained Sub carmings forel RO 00 RO 000 13,351 226,019 24,526 24,526 Total R0'000 116,000 33,368 (1,260) 11 January 2016 Profit for the year Other comprehensive income, net 226,019 24,526 3,188 f tax 3,188 3,188 3,188 27,714 11,000 11,000 19 23 20 2,400 24,526 27,714 11,000 (2,400) (2,453) 1,000 2,453 (1.000) Total comprehensive income for he year ssue of share capital Transfer to special reserve ransfer to legal reserve Transfer to retained cumings nsfer to subordinated debt eserve ssue of Perpetual Tier I capital ponds we expenses of Perpetual Tier apital bonds Dividend paid 22 14,000 (14,000) 24 30,000 30,000 (34) 25 (34) (34) (11,600) (11,600) (11,600) la l. At 31 December 2016 127,000 35,821 25,560 54,000 2,400 8,990 253,099 30,000 283,097