Answered step by step
Verified Expert Solution
Link Copied!

Question

1 Approved Answer

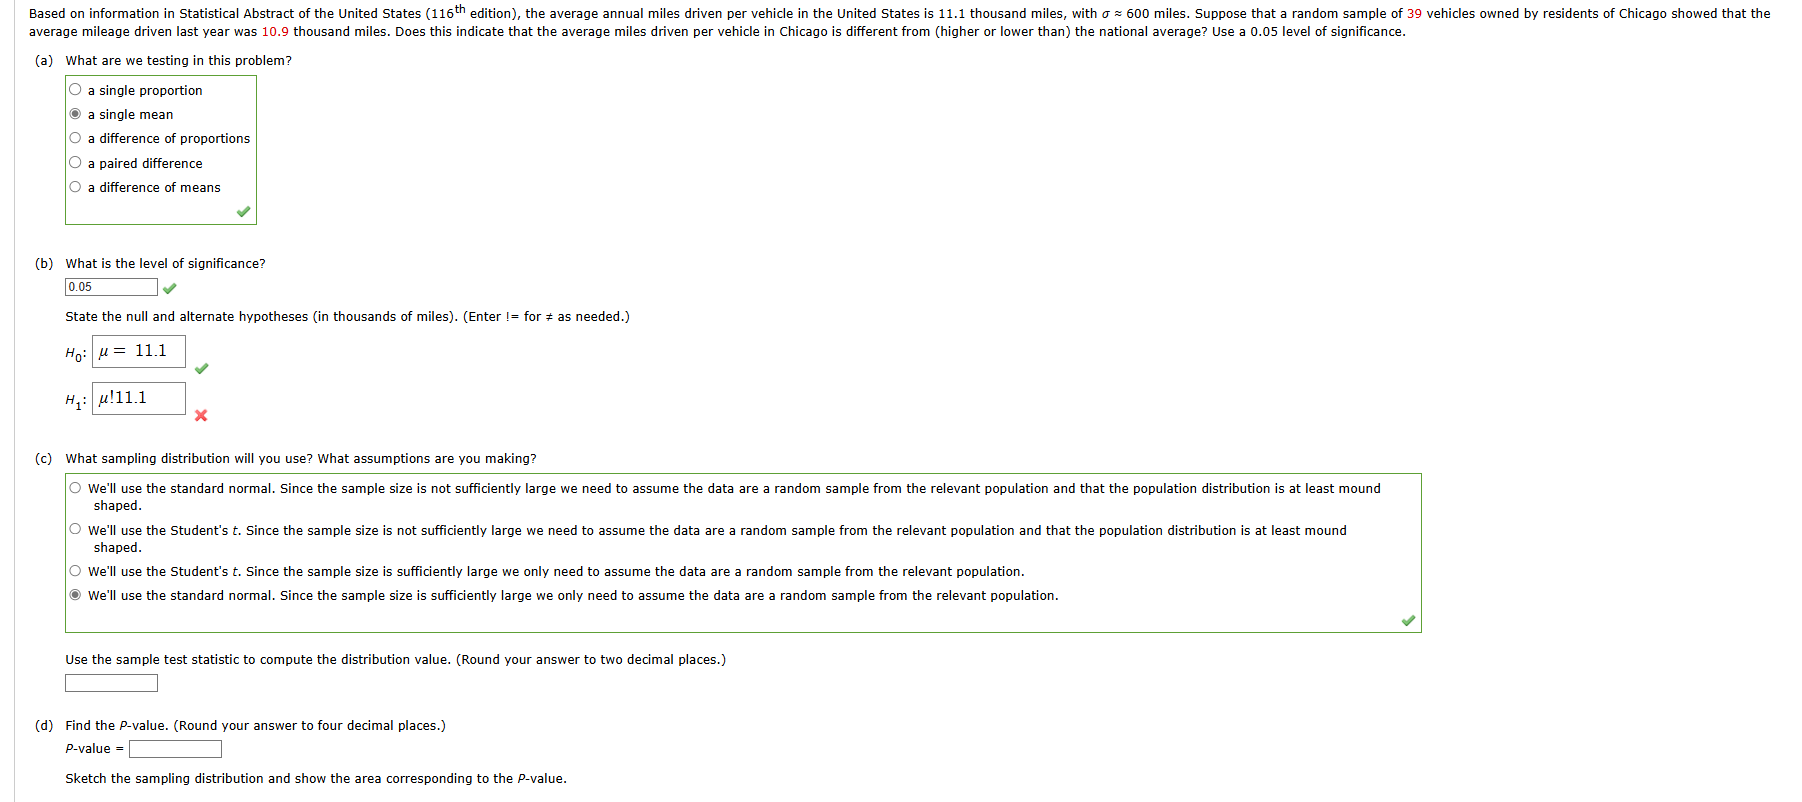
Based on information in Statistical Abstract of the United States (116 edition), the average annual miles driven per vehicle in the United States is 11.1

image text in transcribed
Based on information in Statistical Abstract of the United States (116" edition), the average annual miles driven per vehicle in the United States is 11.1 thousand milles, with o = 600 miles. Suppose that a random sample of 29 vehicles owned by residents of Chicago showed that the average mileage driven last year was 10.9 thousand miles. Does this indicate that the average miles driven per vehicle in Chicago is different from (higher or lower than) the national average? Use a 0.05 level of significance. (3) What are we testing in this problem? a single proportion a single mean a difference of proportions a paired difference a difference of means (b) What is the level of significance? 0.05 i State the null and alternate hypotheses (in thousands of miles). (Enter = for # as needed.) x (c) What sampling distribution will you use? What assumptions are you making? We'll use the standard normal. Since the sample size is not sufficiently large we need to assume the data are a randem sample from the relevant population and that the population distribution is at least mound shaped. O we'll use the Student's t. Since the sample size is not sufficiently large we need to assume the data are a random sample from the relevant population and that the population distribution is at least mound shaped. ) we'll use the Student's . Since the sample size is sufficiently large we only need to assume the data are a random sample from the relevant population. we'll use the standard normal. Since the sample size is sufficiently large we only need to assume the data are a random sample from the relevant population. to compute the distribution value. (Round your answer to twa decimal places.) (d) Find the P-value. (Round your answer to four decimal places.) P-value = Sketch the sampling distribution and show the area corresponding to the P-value

Step by Step Solution

There are 3 Steps involved in it

Step: 1

blur-text-image

Get Instant Access to Expert-Tailored Solutions

See step-by-step solutions with expert insights and AI powered tools for academic success

Step: 2

blur-text-image

Step: 3

blur-text-image

Ace Your Homework with AI

Get the answers you need in no time with our AI-driven, step-by-step assistance

Get Started

Recommended Textbook for

Probability and Stochastic Processes A Friendly Introduction for Electrical and Computer Engineers

Authors: Roy D. Yates, David J. Goodman

3rd edition

1118324560, 978-1118324561

More Books

Students also viewed these Mathematics questions