Answered step by step
Verified Expert Solution
Question
1 Approved Answer
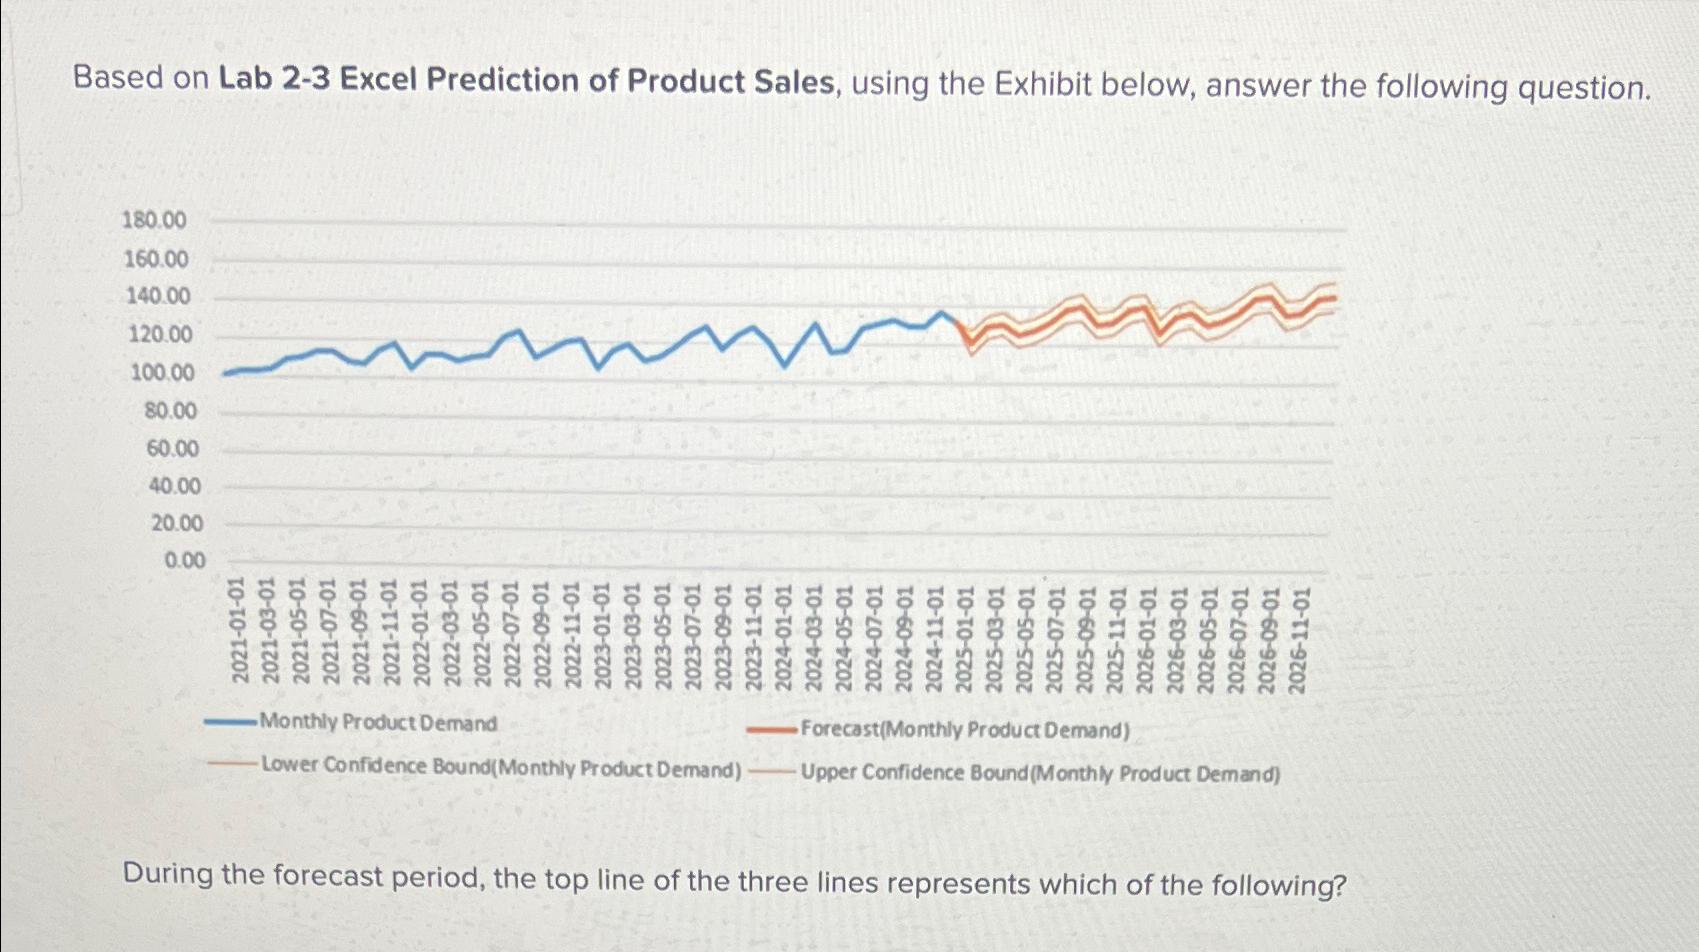
Based on Lab 2 - 3 Excel Prediction of Product Sales, using the Exhibit below, answer the following question. Monthly Product Demand Forecast ( Monthly
Based on Lab Excel Prediction of Product Sales, using the Exhibit below, answer the following question.
Monthly Product Demand ForecastMonthly Product Demand
Lower Confidence BoundMonthly Product Demandper Confidence BoundMonthiy Product Demand
During the forecast period, the top line of the three lines represents which of the following?

Step by Step Solution
There are 3 Steps involved in it
Step: 1

Get Instant Access to Expert-Tailored Solutions
See step-by-step solutions with expert insights and AI powered tools for academic success
Step: 2

Step: 3

Ace Your Homework with AI
Get the answers you need in no time with our AI-driven, step-by-step assistance
Get Started


