Answered step by step
Verified Expert Solution
Question
1 Approved Answer
Based on the above answer the following questions: ( a ) Create a scatter - plot Of weight on the x - axis and percent
Based on the above answer the following questions:
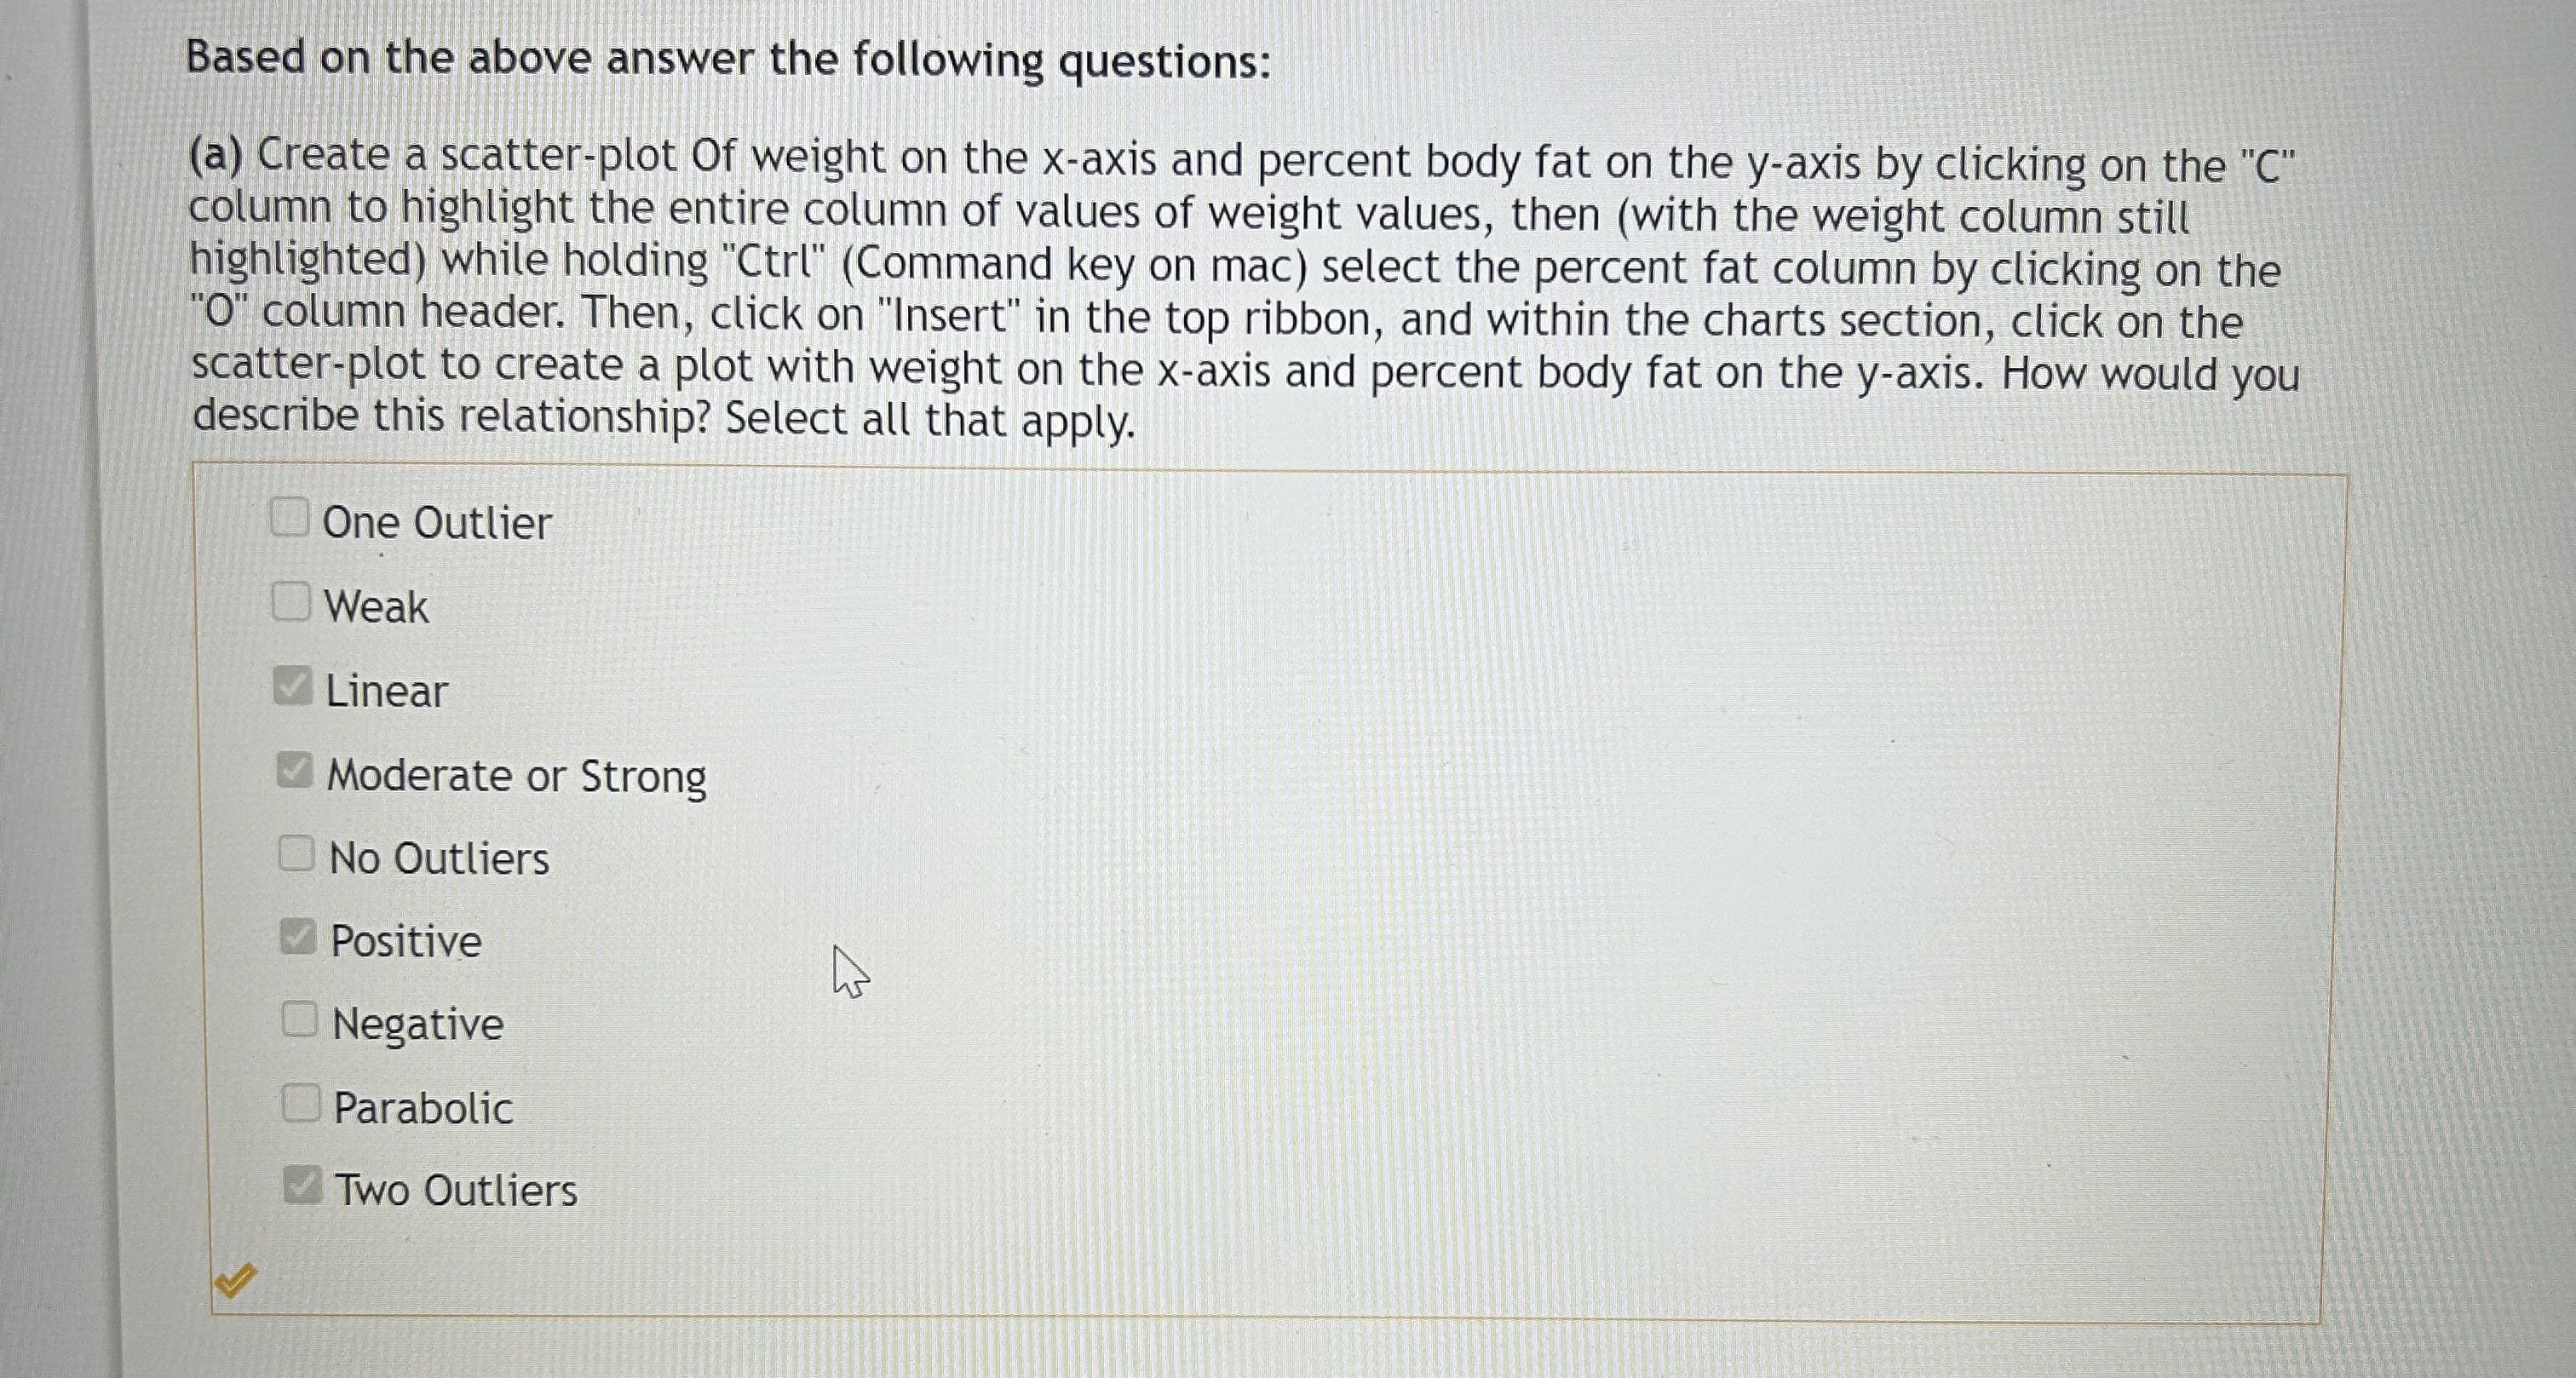
a Create a scatterplot Of weight on the axis and percent body fat on the axis by clicking on the column to highlight the entire column of values of weight values, then with the weight column still highlighted while holding CtrlCommand key on mac select the percent fat column by clicking on the O column header. Then, click on "Insert" in the top ribbon, and within the charts section, click on the scatterplot to create a plot with weight on the axis and percent body fat on the axis. How would you describe this relationship? Select all that apply.
One Outlier
Weak
Linear
Moderate or Strong
No Outliers
Positive
Negative
Parabolic
Two Outliers

Step by Step Solution
There are 3 Steps involved in it
Step: 1

Get Instant Access to Expert-Tailored Solutions
See step-by-step solutions with expert insights and AI powered tools for academic success
Step: 2

Step: 3

Ace Your Homework with AI
Get the answers you need in no time with our AI-driven, step-by-step assistance
Get Started


