Based on the analysis using the data provided for the project, the Treynor's measure for the fund is ______ and the Treynor's measure for the market portfolio to be ______. To help you answer this question, some outputs from the analysis are reproduced below.
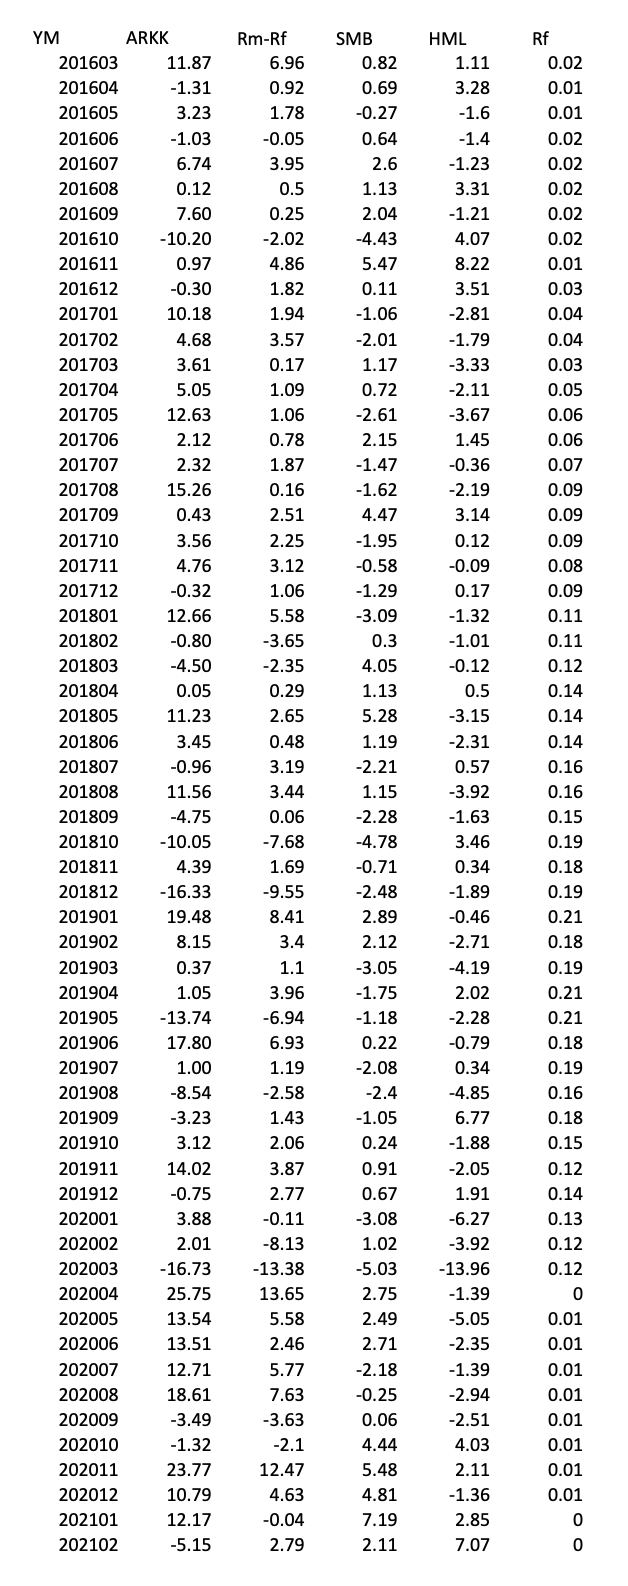
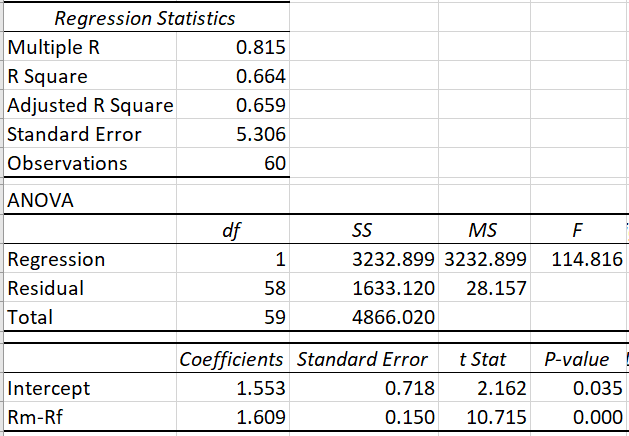
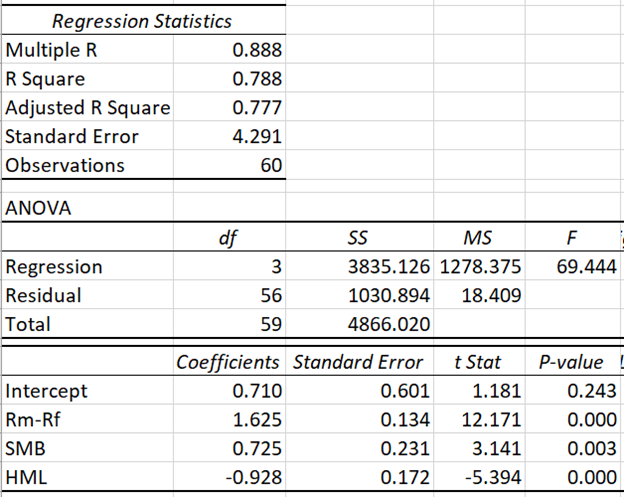
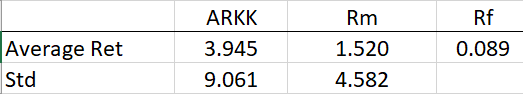
Rf 0.02 0.01 0.01 YM 201603 201604 201605 201606 201607 201608 201609 201610 201611 201612 201701 201702 201703 201704 201705 201706 201707 201708 201709 201710 201711 201712 201801 201802 201803 201804 201805 201806 201807 201808 201809 201810 201811 201812 201901 201902 201903 201904 201905 201906 201907 201908 201909 201910 201911 201912 202001 202002 202003 202004 202005 202006 202007 202008 202009 202010 202011 202012 202101 202102 ARKK 11.87 -1.31 3.23 -1.03 6.74 0.12 7.60 - 10.20 0.97 -0.30 10.18 4.68 3.61 5.05 12.63 2.12 2.32 15.26 0.43 3.56 4.76 -0.32 12.66 -0.80 -4.50 0.05 11.23 3.45 -0.96 11.56 -4.75 -10.05 4.39 -16.33 19.48 8.15 0.37 1.05 -13.74 17.80 1.00 -8.54 -3.23 3.12 14.02 -0.75 3.88 2.01 -16.73 25.75 13.54 13.51 12.71 18.61 -3.49 -1.32 23.77 10.79 12.17 -5.15 Rm-Rf 6.96 0.92 1.78 -0.05 3.95 0.5 0.25 -2.02 4.86 1.82 1.94 3.57 0.17 1.09 1.06 0.78 1.87 0.16 2.51 2.25 3.12 1.06 5.58 -3.65 -2.35 0.29 2.65 0.48 3.19 3.44 0.06 -7.68 1.69 -9.55 8.41 3.4 SMB 0.82 0.69 -0.27 0.64 2.6 1.13 2.04 -4.43 5.47 0.11 -1.06 -2.01 1.17 0.72 -2.61 2.15 -1.47 -1.62 4.47 -1.95 -0.58 -1.29 -3.09 0.3 4.05 1.13 5.28 1.19 -2.21 1.15 -2.28 -4.78 -0.71 -2.48 2.89 2.12 -3.05 -1.75 -1.18 0.22 -2.08 -2.4 -1.05 0.24 0.91 0.67 -3.08 1.02 -5.03 2.75 2.49 2.71 -2.18 -0.25 0.06 4.44 5.48 4.81 7.19 2.11 HML 1.11 3.28 -1.6 -1.4 -1.23 3.31 -1.21 4.07 8.22 3.51 -2.81 -1.79 -3.33 -2.11 -3.67 1.45 -0.36 -2.19 3.14 0.12 -0.09 0.17 -1.32 -1.01 -0.12 0.5 -3.15 -2.31 0.57 -3.92 -1.63 3.46 0.34 -1.89 -0.46 -2.71 -4.19 2.02 -2.28 -0.79 0.34 -4.85 6.77 -1.88 -2.05 1.91 -6.27 -3.92 -13.96 -1.39 -5.05 -2.35 -1.39 -2.94 -2.51 4.03 2.11 -1.36 2.85 7.07 0.02 0.02 0.02 0.02 0.02 0.01 0.03 0.04 0.04 0.03 0.05 0.06 0.06 0.07 0.09 0.09 0.09 0.08 0.09 0.11 0.11 0.12 0.14 0.14 0.14 0.16 0.16 0.15 0.19 0.18 0.19 0.21 0.18 0.19 0.21 0.21 0.18 0.19 0.16 0.18 0.15 0.12 0.14 0.13 0.12 0.12 0 0.01 0.01 0.01 0.01 1.1 3.96 -6.94 6.93 1.19 -2.58 1.43 2.06 3.87 2.77 -0.11 -8.13 -13.38 13.65 5.58 2.46 5.77 7.63 -3.63 -2.1 12.47 4.63 -0.04 2.79 0.01 0.01 0.01 0.01 0 0 Regression Statistics Multiple R 0.815 R Square 0.664 Adjusted R Square 0.659 Standard Error 5.306 Observations 60 ANOVA df F 1 114.816 Regression Residual Total SS MS 3232.899 3232.899 1633.120 28.157 4866.020 58 59 Intercept Rm-Rf Coefficients Standard Error 1.553 0.718 1.609 0.150 t Stat 2.162 10.715 P-value 0.035 0.000 Regression Statistics Multiple R 0.888 R Square 0.788 Adjusted R Square 0.777 Standard Error 4.291 Observations 60 ANOVA df F 69.444 Regression Residual Total 3 56 59 SS MS 3835.126 1278.375 1030.894 18.409 4866.020 Intercept Rm-Rf SMB HML Coefficients Standard Error 0.710 0.601 1.625 0.134 0.725 0.231 -0.928 0.172 t Stat 1.181 12.171 3.141 -5.394 P-value ! 0.243 0.000 0.003 0.000 ARKK 3.945 9.061 Rm 1.520 Rf 0.089 Average Ret Std 4.582 Rf 0.02 0.01 0.01 YM 201603 201604 201605 201606 201607 201608 201609 201610 201611 201612 201701 201702 201703 201704 201705 201706 201707 201708 201709 201710 201711 201712 201801 201802 201803 201804 201805 201806 201807 201808 201809 201810 201811 201812 201901 201902 201903 201904 201905 201906 201907 201908 201909 201910 201911 201912 202001 202002 202003 202004 202005 202006 202007 202008 202009 202010 202011 202012 202101 202102 ARKK 11.87 -1.31 3.23 -1.03 6.74 0.12 7.60 - 10.20 0.97 -0.30 10.18 4.68 3.61 5.05 12.63 2.12 2.32 15.26 0.43 3.56 4.76 -0.32 12.66 -0.80 -4.50 0.05 11.23 3.45 -0.96 11.56 -4.75 -10.05 4.39 -16.33 19.48 8.15 0.37 1.05 -13.74 17.80 1.00 -8.54 -3.23 3.12 14.02 -0.75 3.88 2.01 -16.73 25.75 13.54 13.51 12.71 18.61 -3.49 -1.32 23.77 10.79 12.17 -5.15 Rm-Rf 6.96 0.92 1.78 -0.05 3.95 0.5 0.25 -2.02 4.86 1.82 1.94 3.57 0.17 1.09 1.06 0.78 1.87 0.16 2.51 2.25 3.12 1.06 5.58 -3.65 -2.35 0.29 2.65 0.48 3.19 3.44 0.06 -7.68 1.69 -9.55 8.41 3.4 SMB 0.82 0.69 -0.27 0.64 2.6 1.13 2.04 -4.43 5.47 0.11 -1.06 -2.01 1.17 0.72 -2.61 2.15 -1.47 -1.62 4.47 -1.95 -0.58 -1.29 -3.09 0.3 4.05 1.13 5.28 1.19 -2.21 1.15 -2.28 -4.78 -0.71 -2.48 2.89 2.12 -3.05 -1.75 -1.18 0.22 -2.08 -2.4 -1.05 0.24 0.91 0.67 -3.08 1.02 -5.03 2.75 2.49 2.71 -2.18 -0.25 0.06 4.44 5.48 4.81 7.19 2.11 HML 1.11 3.28 -1.6 -1.4 -1.23 3.31 -1.21 4.07 8.22 3.51 -2.81 -1.79 -3.33 -2.11 -3.67 1.45 -0.36 -2.19 3.14 0.12 -0.09 0.17 -1.32 -1.01 -0.12 0.5 -3.15 -2.31 0.57 -3.92 -1.63 3.46 0.34 -1.89 -0.46 -2.71 -4.19 2.02 -2.28 -0.79 0.34 -4.85 6.77 -1.88 -2.05 1.91 -6.27 -3.92 -13.96 -1.39 -5.05 -2.35 -1.39 -2.94 -2.51 4.03 2.11 -1.36 2.85 7.07 0.02 0.02 0.02 0.02 0.02 0.01 0.03 0.04 0.04 0.03 0.05 0.06 0.06 0.07 0.09 0.09 0.09 0.08 0.09 0.11 0.11 0.12 0.14 0.14 0.14 0.16 0.16 0.15 0.19 0.18 0.19 0.21 0.18 0.19 0.21 0.21 0.18 0.19 0.16 0.18 0.15 0.12 0.14 0.13 0.12 0.12 0 0.01 0.01 0.01 0.01 1.1 3.96 -6.94 6.93 1.19 -2.58 1.43 2.06 3.87 2.77 -0.11 -8.13 -13.38 13.65 5.58 2.46 5.77 7.63 -3.63 -2.1 12.47 4.63 -0.04 2.79 0.01 0.01 0.01 0.01 0 0 Regression Statistics Multiple R 0.815 R Square 0.664 Adjusted R Square 0.659 Standard Error 5.306 Observations 60 ANOVA df F 1 114.816 Regression Residual Total SS MS 3232.899 3232.899 1633.120 28.157 4866.020 58 59 Intercept Rm-Rf Coefficients Standard Error 1.553 0.718 1.609 0.150 t Stat 2.162 10.715 P-value 0.035 0.000 Regression Statistics Multiple R 0.888 R Square 0.788 Adjusted R Square 0.777 Standard Error 4.291 Observations 60 ANOVA df F 69.444 Regression Residual Total 3 56 59 SS MS 3835.126 1278.375 1030.894 18.409 4866.020 Intercept Rm-Rf SMB HML Coefficients Standard Error 0.710 0.601 1.625 0.134 0.725 0.231 -0.928 0.172 t Stat 1.181 12.171 3.141 -5.394 P-value ! 0.243 0.000 0.003 0.000 ARKK 3.945 9.061 Rm 1.520 Rf 0.089 Average Ret Std 4.582