

Answered step by step
Verified Expert Solution
Question
1 Approved Answer
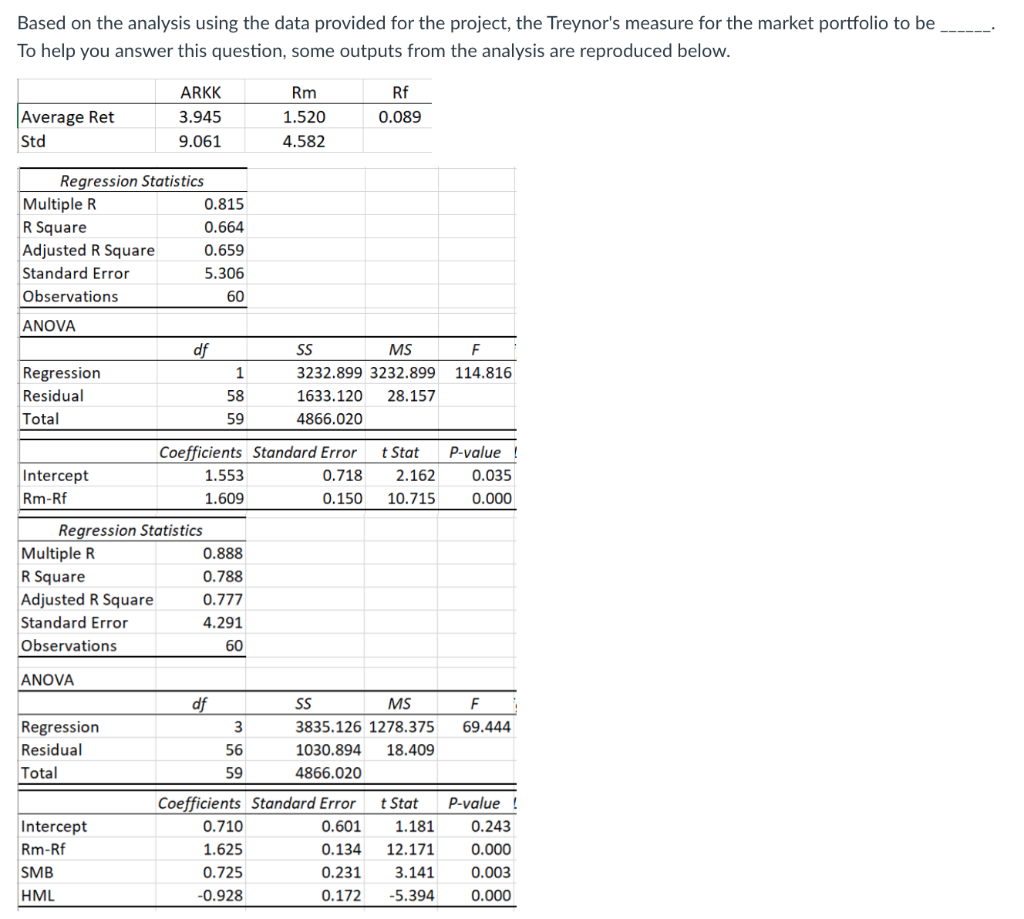
Based on the analysis using the data provided for the project, the Treynor's measure for the market portfolio to be To help you answer this
Step by Step Solution
There are 3 Steps involved in it
Step: 1

Get Instant Access to Expert-Tailored Solutions
See step-by-step solutions with expert insights and AI powered tools for academic success
Step: 2

Step: 3
Ace Your Homework with AI
Get the answers you need in no time with our AI-driven, step-by-step assistance
Get Started
Bitcoin Complete Guide To Bitcoin Understand Everything From Getting Started With Bitcoin Sending And Receiving Bitcoin To Mining Bitcoin
Authors: Mr Mark Gates
1st Edition
1974565491, 978-1974565498