Based on the balance sheet and income statement data of APPLE INC. discuss and analyze the financial performance of the company. Your discussion and analysis should focus on the following items, but not limited to these factors. Compute the ratios for at least 2020 and 2019
- Compute and analyze the operating activity based profitability ratios such as
- Net-operating profit after tax (NOPAT)
- Return on net-operating Assets (RNOA)
- Net-operating profit Margin (NOPM
- Calculate and discuss the cash conversion cycle of the company.
- Compute and analyze the return on equity (ROE) of the company using the DuPont analysis model.
- Calculate and discuss the coverage ratios such as Time-interest earned, EBITDA, and solvency ratios such as total debt ratio and debt to equity ratios.
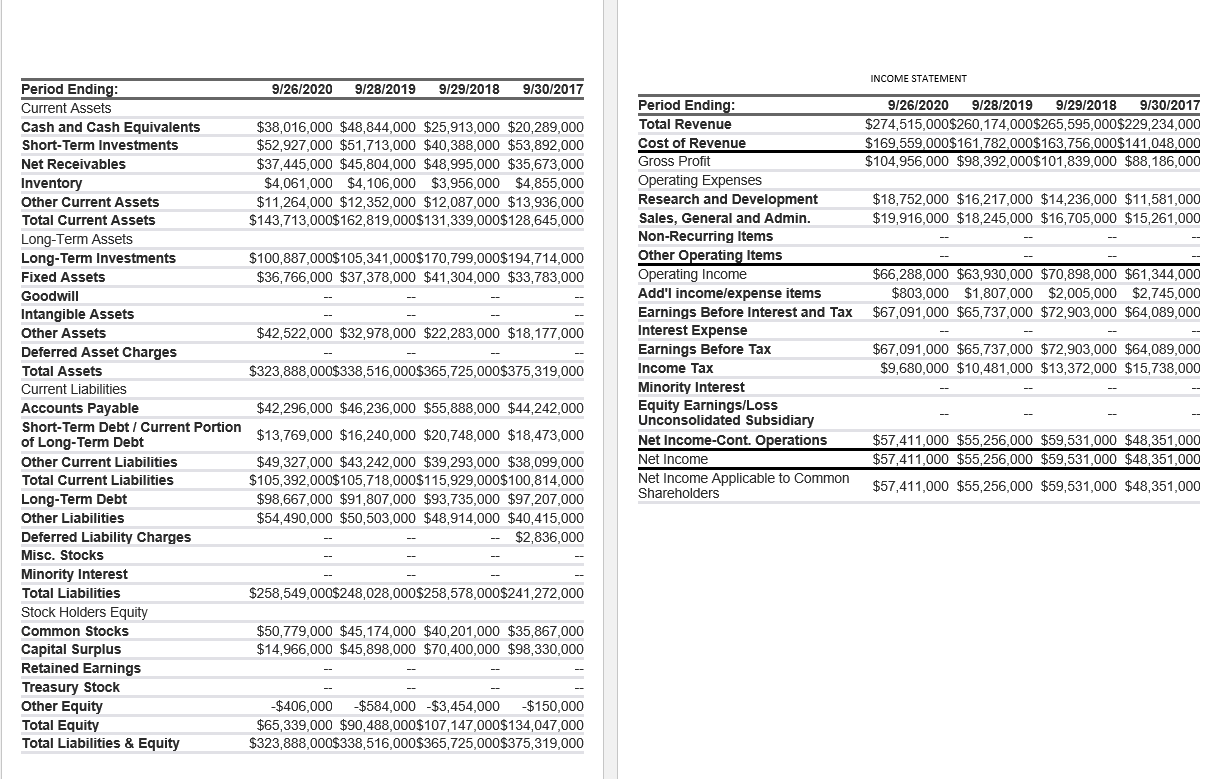
INCOME STATEMENT 9/26/2020 9/28/2019 9/29/2018 9/30/2017 $274,515,000$260,174,000$265,595,000$229,234,000 $169,559,000$161,782,000$163,756,000$141,048,000 $104,956,000 $98,392,000$101,839,000 $88,186,000 $18,752,000 $16,217,000 $14,236,000 $11,581,000 $19,916,000 $18,245,000 $16,705,000 $15,261,000 Period Ending: Total Revenue Cost of Revenue Gross Profit Operating Expenses Research and Development Sales, General and Admin. Non-Recurring Items Other Operating Items Operating Income Add'l incomelexpense items Earnings Before Interest and Tax Interest Expense Earnings Before Tax Income Tax Minority Interest Equity Earnings/Loss Unconsolidated Subsidiary Net Income-Cont. Operations Net Income Net Income Applicable to Common Shareholders $66,288,000 $63,930,000 $70,898,000 $61,344,000 $803,000 $1,807,000 $2,005,000 $2,745,000 $67,091,000 $65,737,000 $72,903,000 $64,089,000 Period Ending: 9/26/2020 9/28/2019 9/29/2018 9/30/2017 Current Assets Cash and Cash Equivalents $38,016,000 $48,844,000 $25,913,000 $20,289,000 Short-Term Investments $52,927,000 $51,713,000 $40,388,000 $53,892,000 Net Receivables $37,445,000 $45,804,000 $48,995,000 $35,673,000 Inventory $4,061,000 $4,106,000 $3,956,000 $4,855,000 Other Current Assets $11,264,000 $12,352,000 $12,087,000 $13,936,000 Total Current Assets $143,713,000$162,819,000$131,339,000$128,645,000 Long-Term Assets Long-Term Investments $100,887,000$ 105,341,000$170,799,000$194,714,000 Fixed Assets $36,766,000 $37,378,000 $41,304,000 $33,783,000 Goodwill Intangible Assets Other Assets $42,522,000 $32,978,000 $22,283,000 $18,177,000 Deferred Asset Charges Total Assets $323,888,000$338,516,000$365,725,000$375,319,000 Current Liabilities Accounts Payable $42,296,000 $46,236,000 $55,888,000 $44,242,000 Short-Term Debt / Current Portion $13,769,000 $16,240,000 $20,748,000 $18,473,000 of Long-Term Debt Other Currel Liabilities $49,327,000 $43,242,000 $39,293,000 $38,099,000 Total Current Liabilities $105,392,000$105,718,000$115,929,000$100,814,000 Long-Term Debt $98,667,000 $91,807,000 $93,735,000 $97,207,000 Other Liabilities $54,490,000 $50,503,000 $48,914,000 $40,415,000 Deferred Liability Charges $2,836,000 Misc. Stocks Minority Interest Total Liabilities $258,549,000$248,028,000$258,578,000$241,272,000 Stock Holders Equity Common Stocks $50,779,000 $45,174,000 $40,201,000 $35,867,000 Capital Surplus $14,966,000 $45,898,000 $70,400,000 $98,330,000 Retained Earnings Treasury Stock Other Equity -$406,000 $584,000 $3,454,000 $150,000 Total Equity $65,339,000 $90,488,000$107,147,000$134,047,000 Total Liabilities & Equity $323,888,000$338,516,000$365,725,000$375,319,000 $67,091,000 $65,737,000 $72,903,000 $64,089,000 $9,680,000 $10,481,000 $13,372,000 $15,738,000 $57,411,000 $55,256,000 $59,531,000 $48,351,000 $57,411,000 $55,256,000 $59,531,000 $48,351,000 $57,411,000 $55,256,000 $59,531,000 $48,351,000 INCOME STATEMENT 9/26/2020 9/28/2019 9/29/2018 9/30/2017 $274,515,000$260,174,000$265,595,000$229,234,000 $169,559,000$161,782,000$163,756,000$141,048,000 $104,956,000 $98,392,000$101,839,000 $88,186,000 $18,752,000 $16,217,000 $14,236,000 $11,581,000 $19,916,000 $18,245,000 $16,705,000 $15,261,000 Period Ending: Total Revenue Cost of Revenue Gross Profit Operating Expenses Research and Development Sales, General and Admin. Non-Recurring Items Other Operating Items Operating Income Add'l incomelexpense items Earnings Before Interest and Tax Interest Expense Earnings Before Tax Income Tax Minority Interest Equity Earnings/Loss Unconsolidated Subsidiary Net Income-Cont. Operations Net Income Net Income Applicable to Common Shareholders $66,288,000 $63,930,000 $70,898,000 $61,344,000 $803,000 $1,807,000 $2,005,000 $2,745,000 $67,091,000 $65,737,000 $72,903,000 $64,089,000 Period Ending: 9/26/2020 9/28/2019 9/29/2018 9/30/2017 Current Assets Cash and Cash Equivalents $38,016,000 $48,844,000 $25,913,000 $20,289,000 Short-Term Investments $52,927,000 $51,713,000 $40,388,000 $53,892,000 Net Receivables $37,445,000 $45,804,000 $48,995,000 $35,673,000 Inventory $4,061,000 $4,106,000 $3,956,000 $4,855,000 Other Current Assets $11,264,000 $12,352,000 $12,087,000 $13,936,000 Total Current Assets $143,713,000$162,819,000$131,339,000$128,645,000 Long-Term Assets Long-Term Investments $100,887,000$ 105,341,000$170,799,000$194,714,000 Fixed Assets $36,766,000 $37,378,000 $41,304,000 $33,783,000 Goodwill Intangible Assets Other Assets $42,522,000 $32,978,000 $22,283,000 $18,177,000 Deferred Asset Charges Total Assets $323,888,000$338,516,000$365,725,000$375,319,000 Current Liabilities Accounts Payable $42,296,000 $46,236,000 $55,888,000 $44,242,000 Short-Term Debt / Current Portion $13,769,000 $16,240,000 $20,748,000 $18,473,000 of Long-Term Debt Other Currel Liabilities $49,327,000 $43,242,000 $39,293,000 $38,099,000 Total Current Liabilities $105,392,000$105,718,000$115,929,000$100,814,000 Long-Term Debt $98,667,000 $91,807,000 $93,735,000 $97,207,000 Other Liabilities $54,490,000 $50,503,000 $48,914,000 $40,415,000 Deferred Liability Charges $2,836,000 Misc. Stocks Minority Interest Total Liabilities $258,549,000$248,028,000$258,578,000$241,272,000 Stock Holders Equity Common Stocks $50,779,000 $45,174,000 $40,201,000 $35,867,000 Capital Surplus $14,966,000 $45,898,000 $70,400,000 $98,330,000 Retained Earnings Treasury Stock Other Equity -$406,000 $584,000 $3,454,000 $150,000 Total Equity $65,339,000 $90,488,000$107,147,000$134,047,000 Total Liabilities & Equity $323,888,000$338,516,000$365,725,000$375,319,000 $67,091,000 $65,737,000 $72,903,000 $64,089,000 $9,680,000 $10,481,000 $13,372,000 $15,738,000 $57,411,000 $55,256,000 $59,531,000 $48,351,000 $57,411,000 $55,256,000 $59,531,000 $48,351,000 $57,411,000 $55,256,000 $59,531,000 $48,351,000