Based on the calculation below, give the written explanation step by step for selection 5,6,7,8 Reference: 4) What proportion of the change in Sales can
Based on the calculation below, give the written explanation step by step for selection 5,6,7,8
Reference:
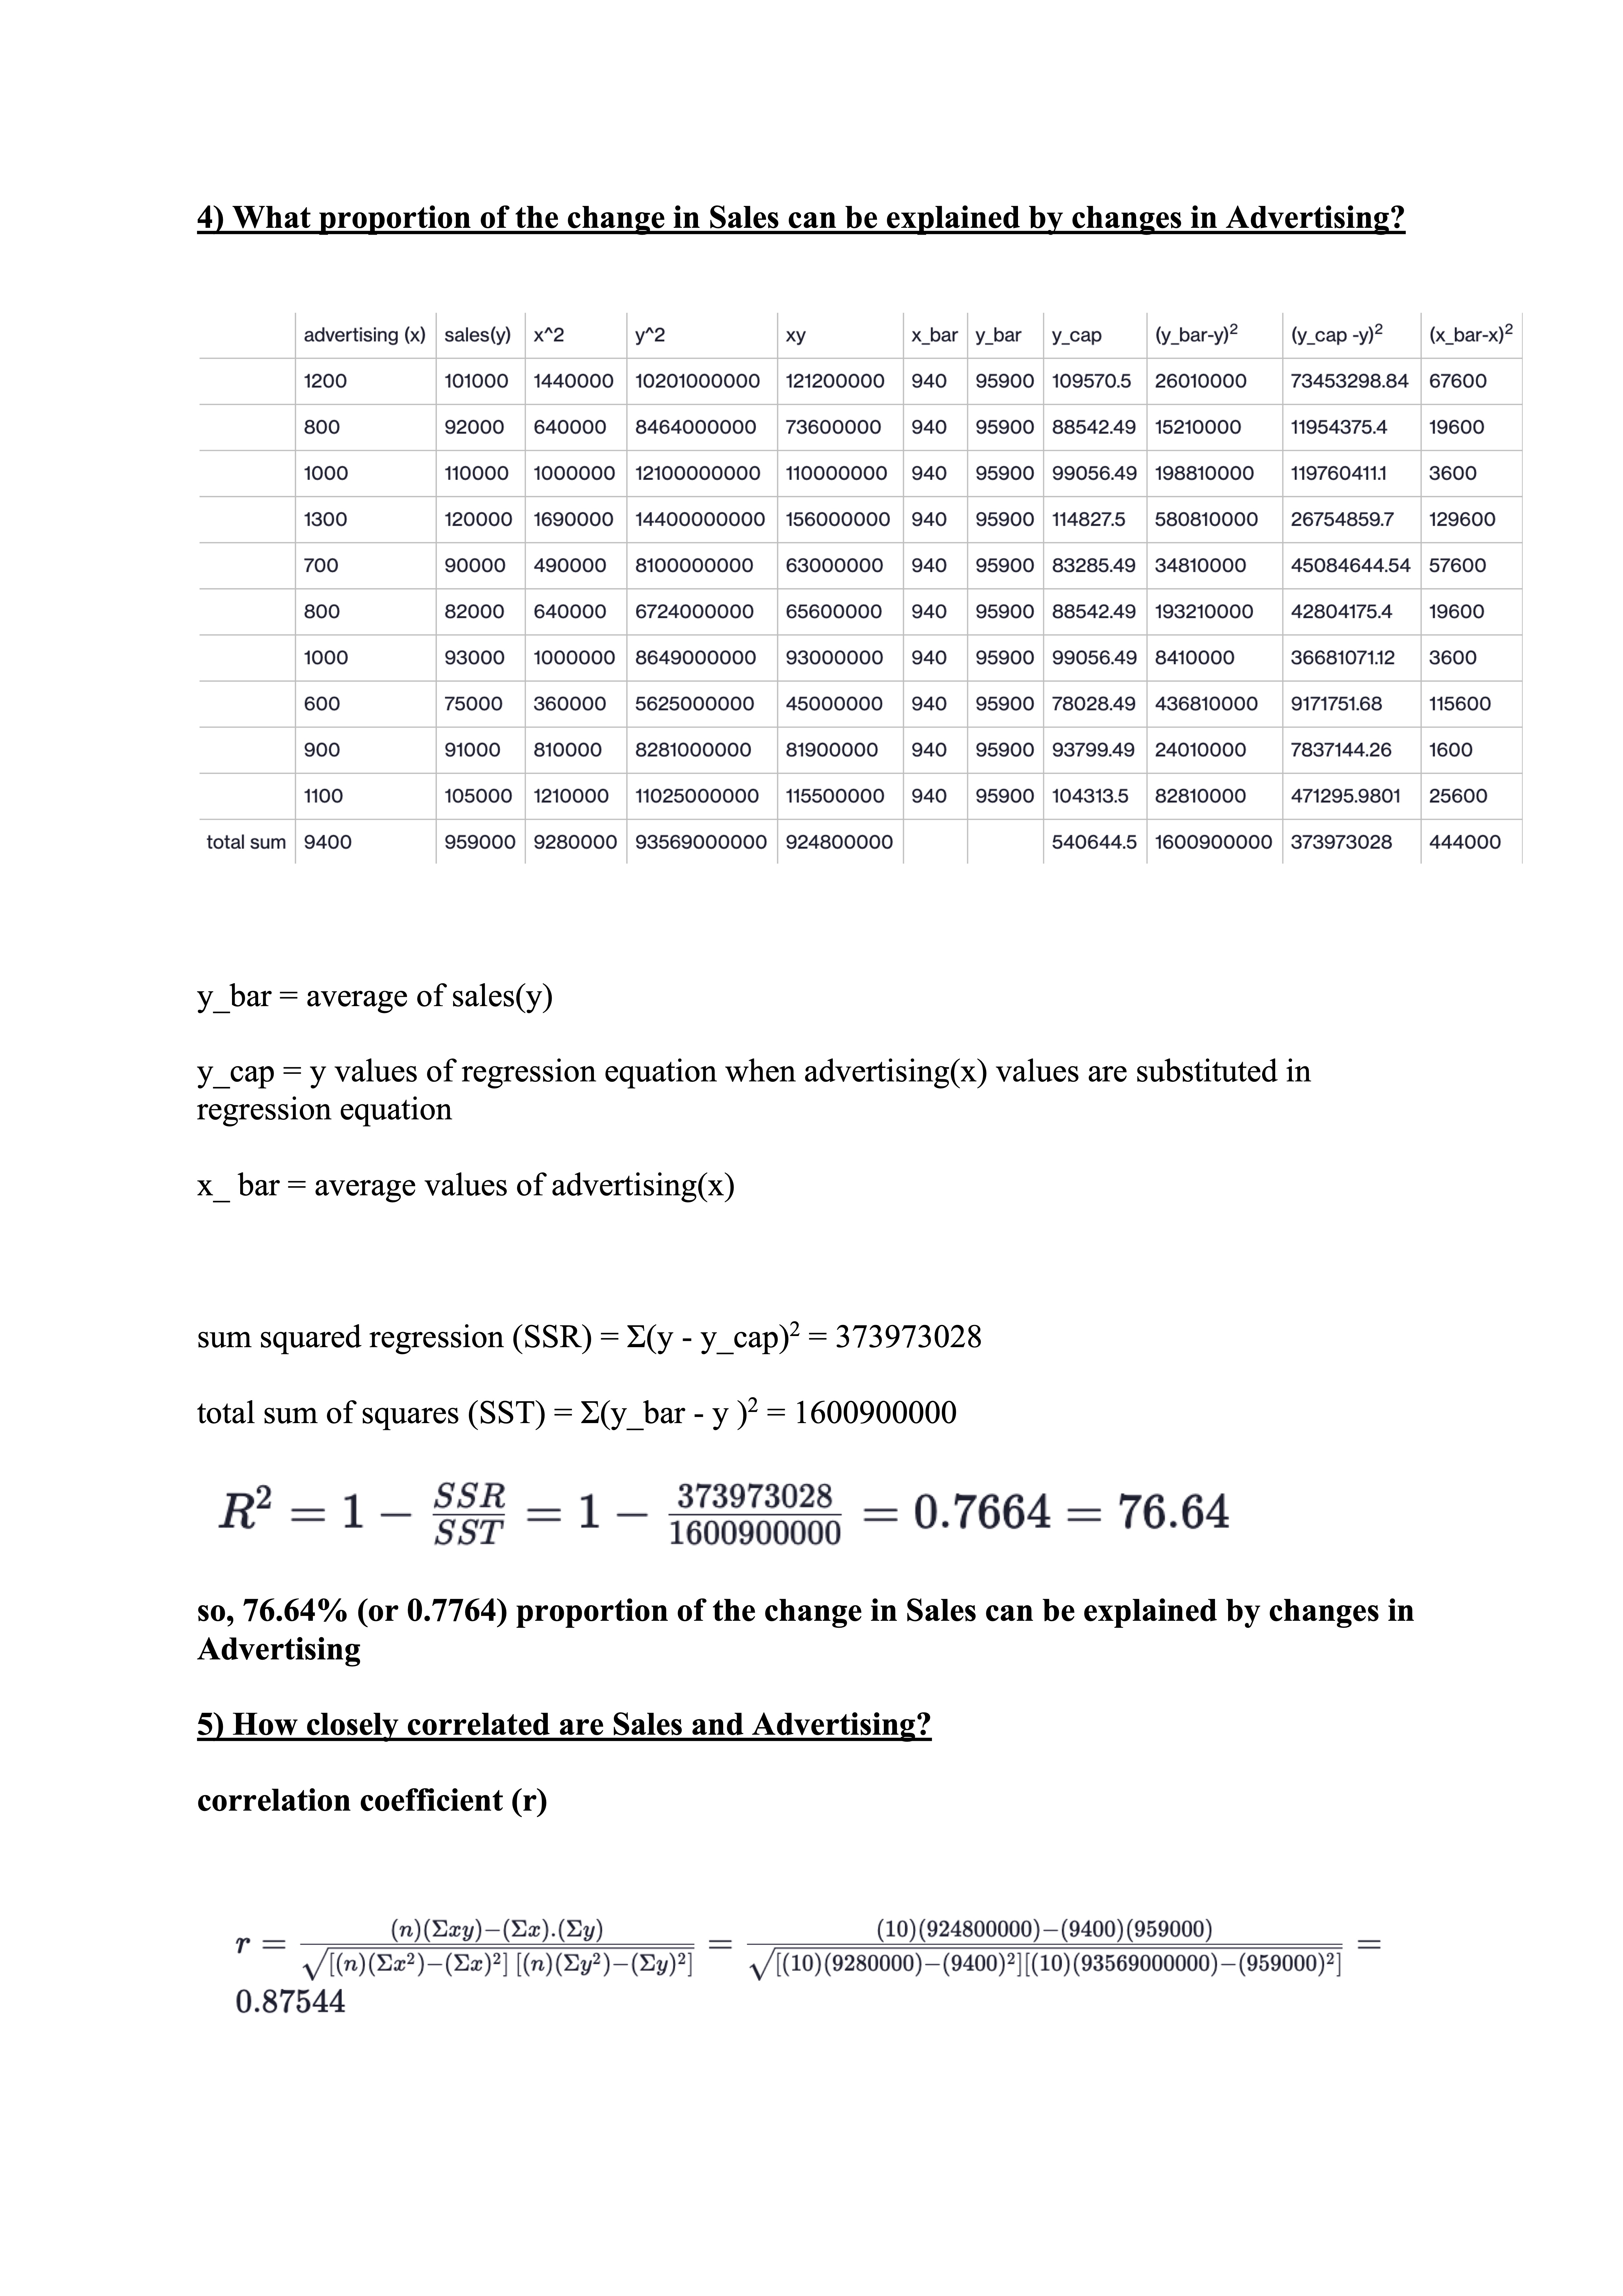
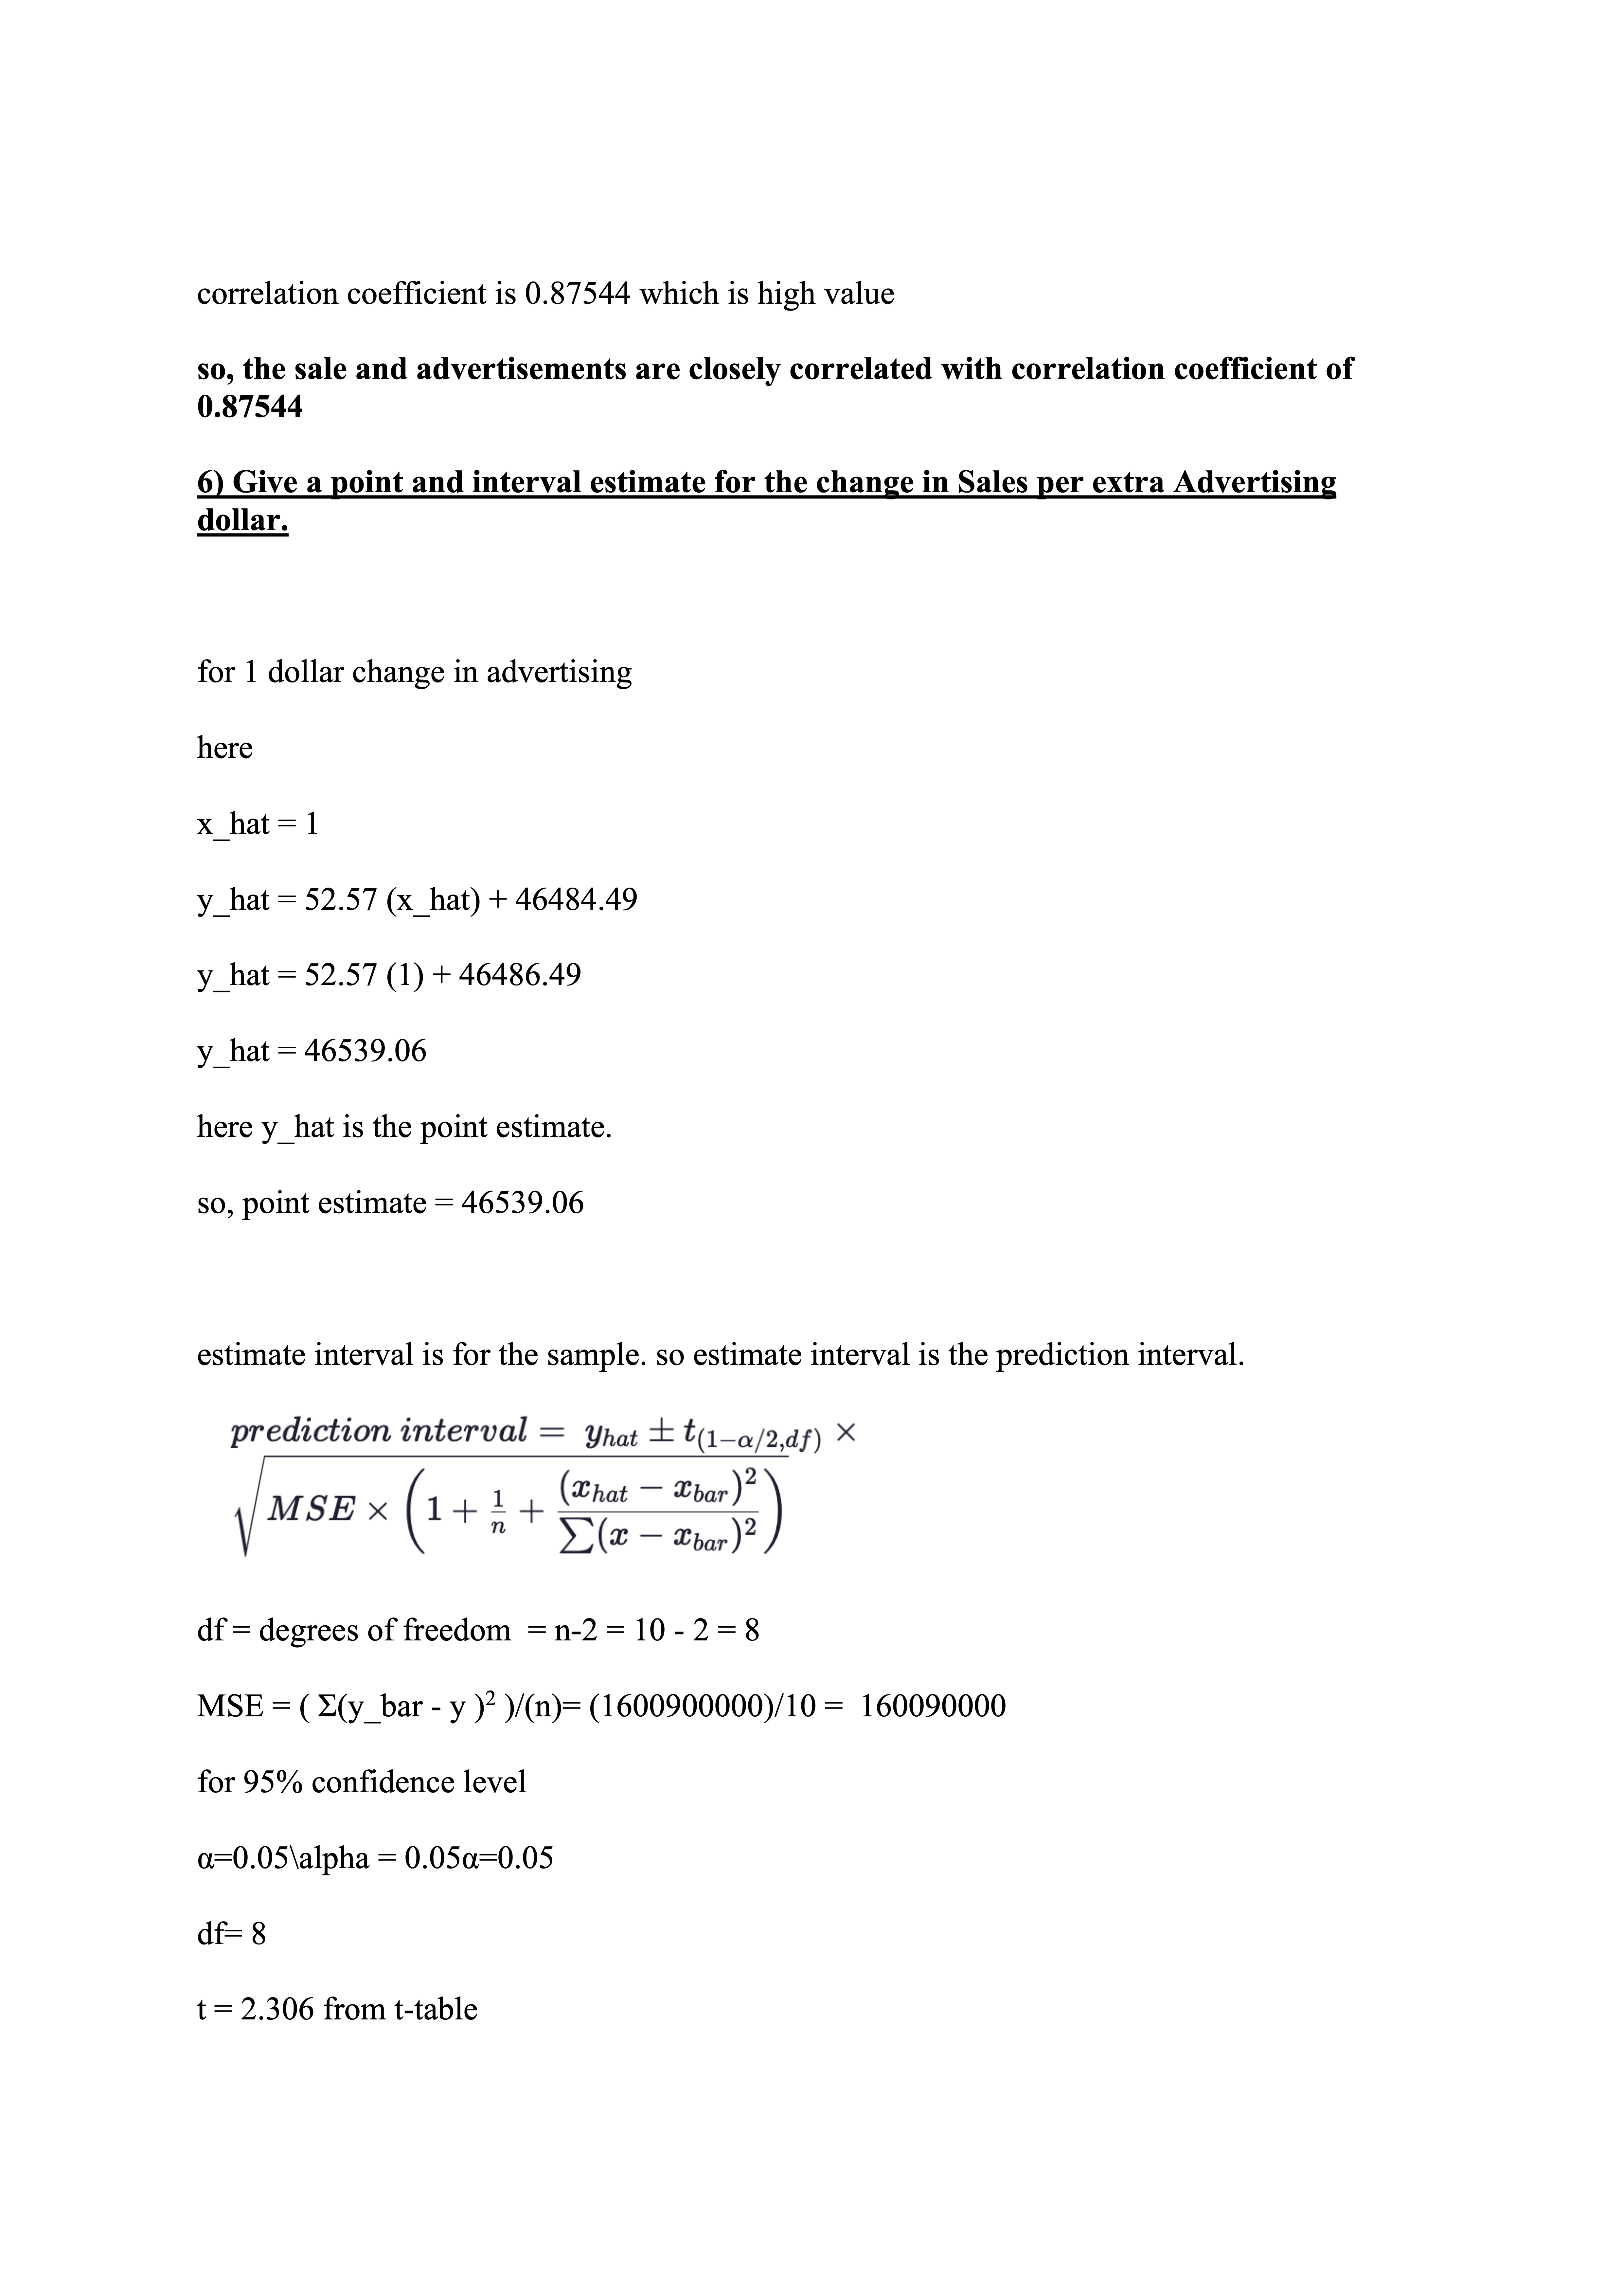
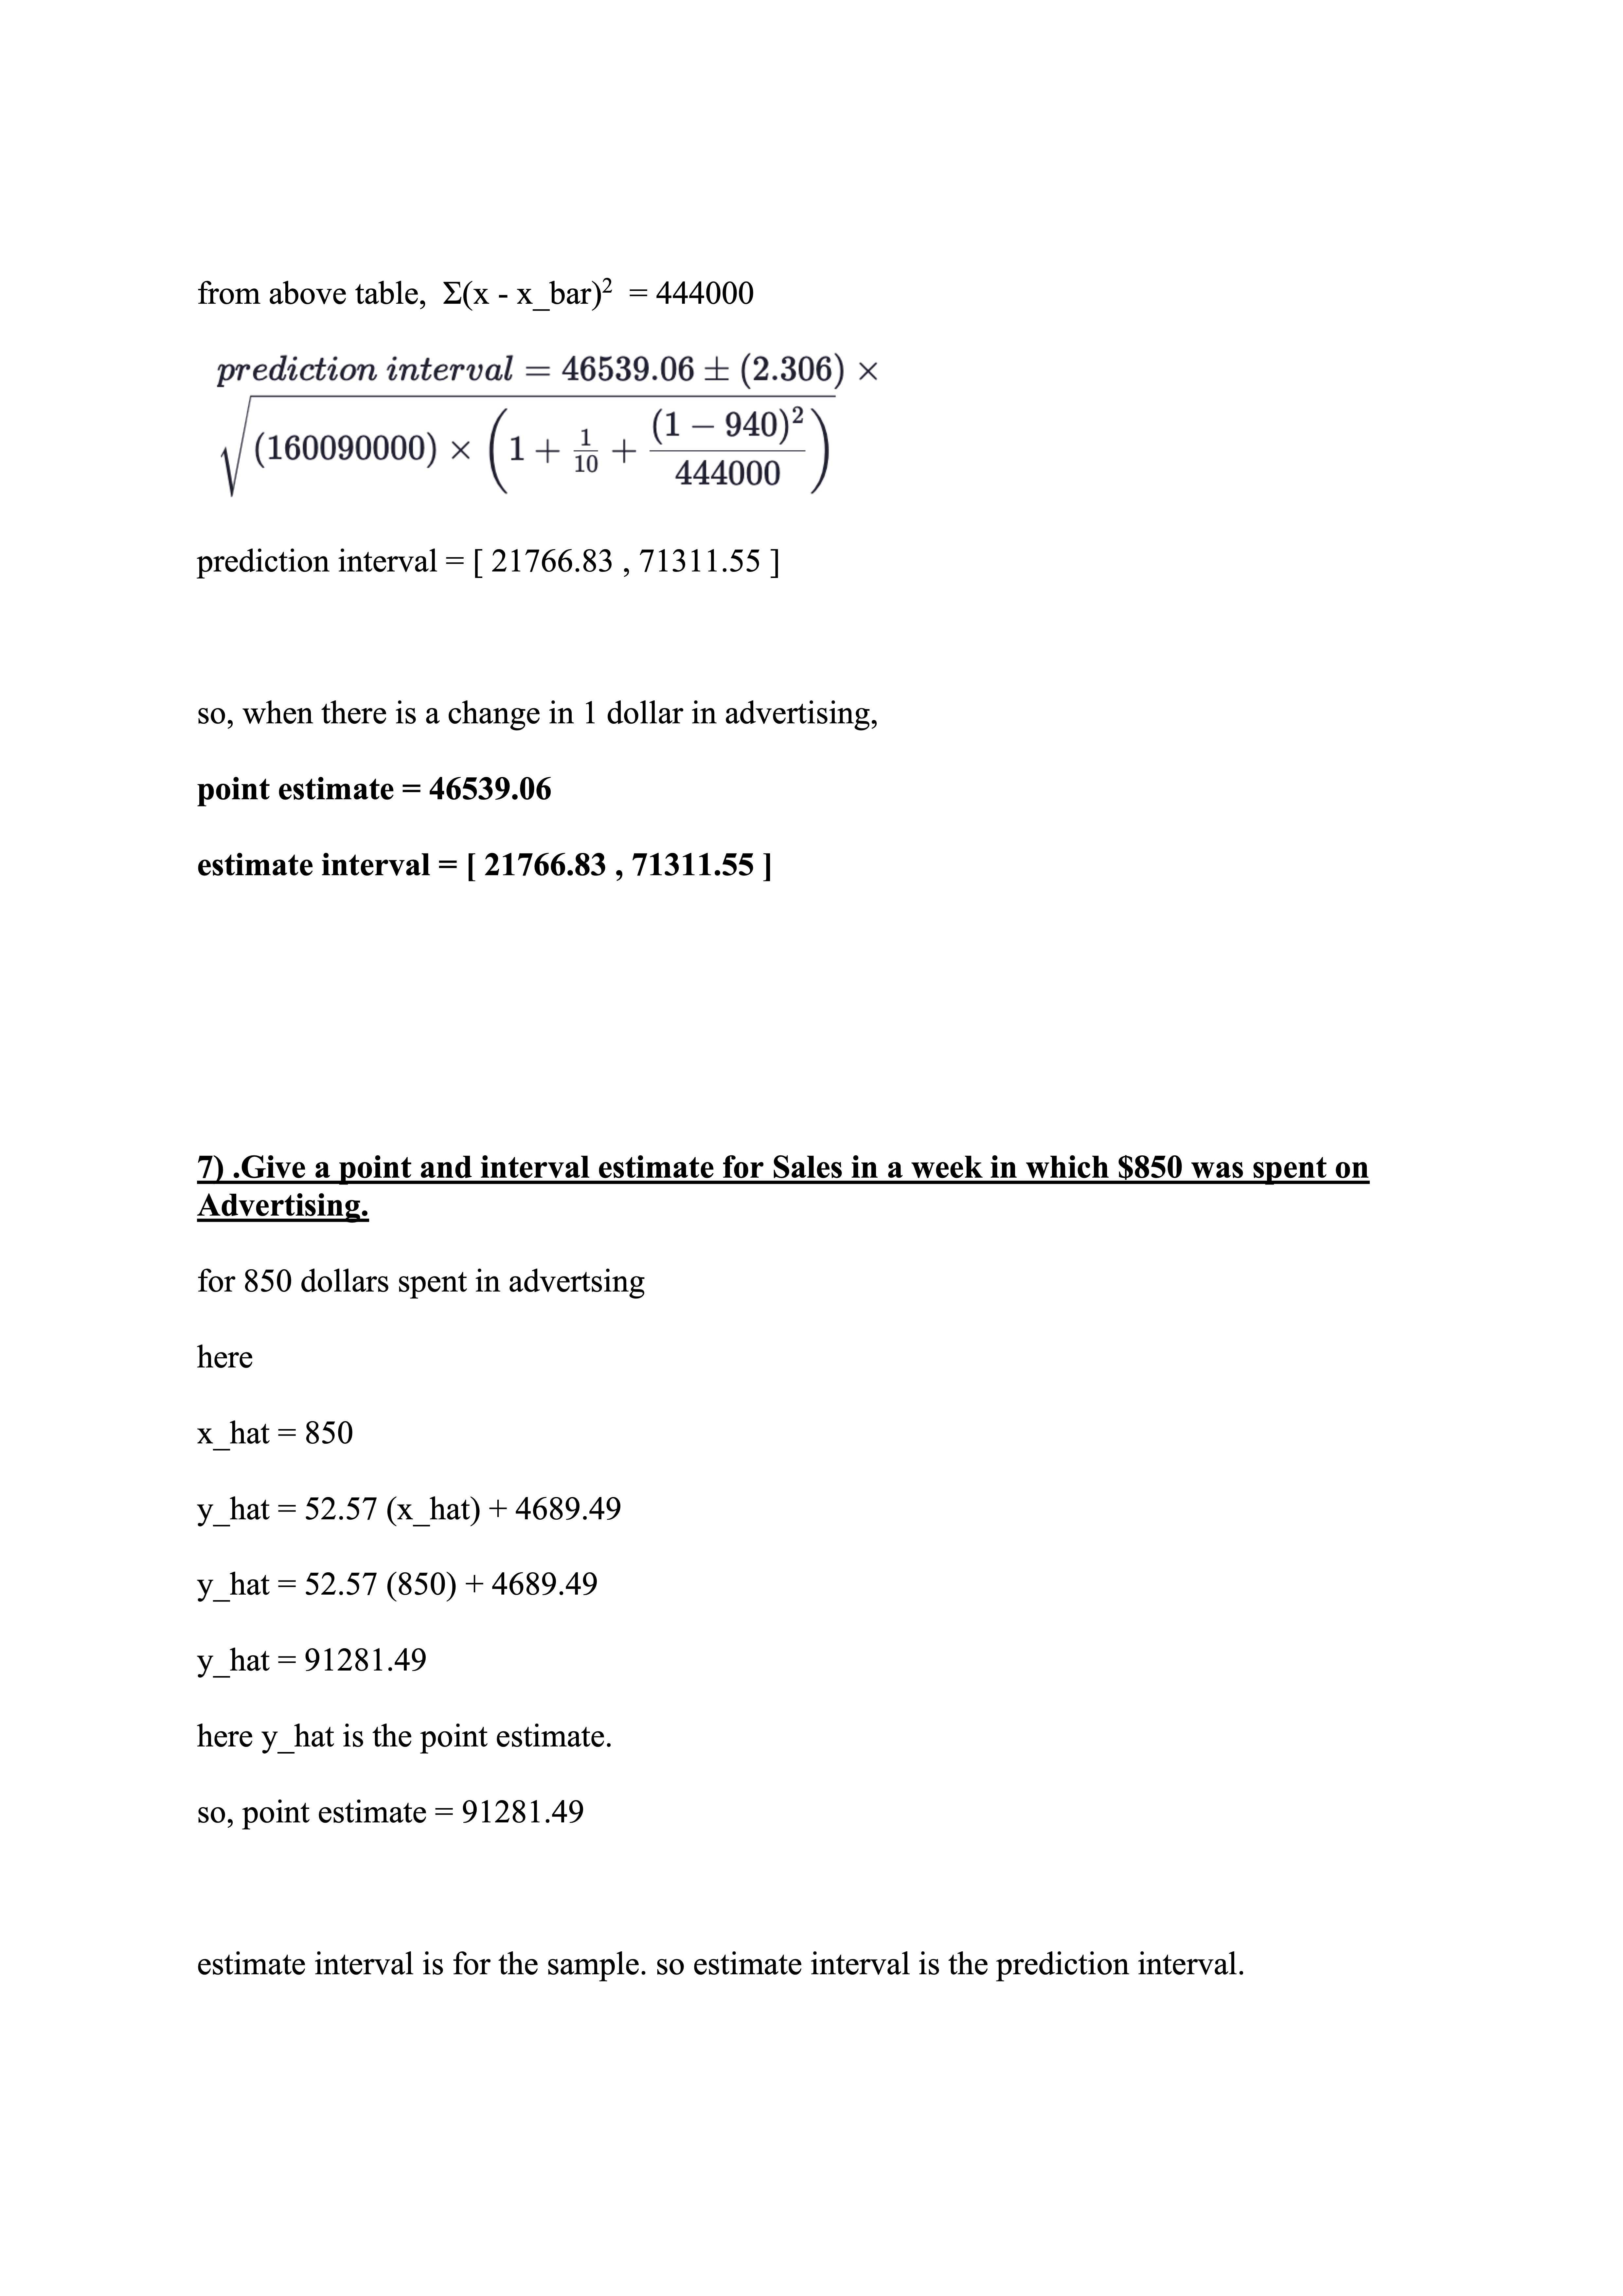
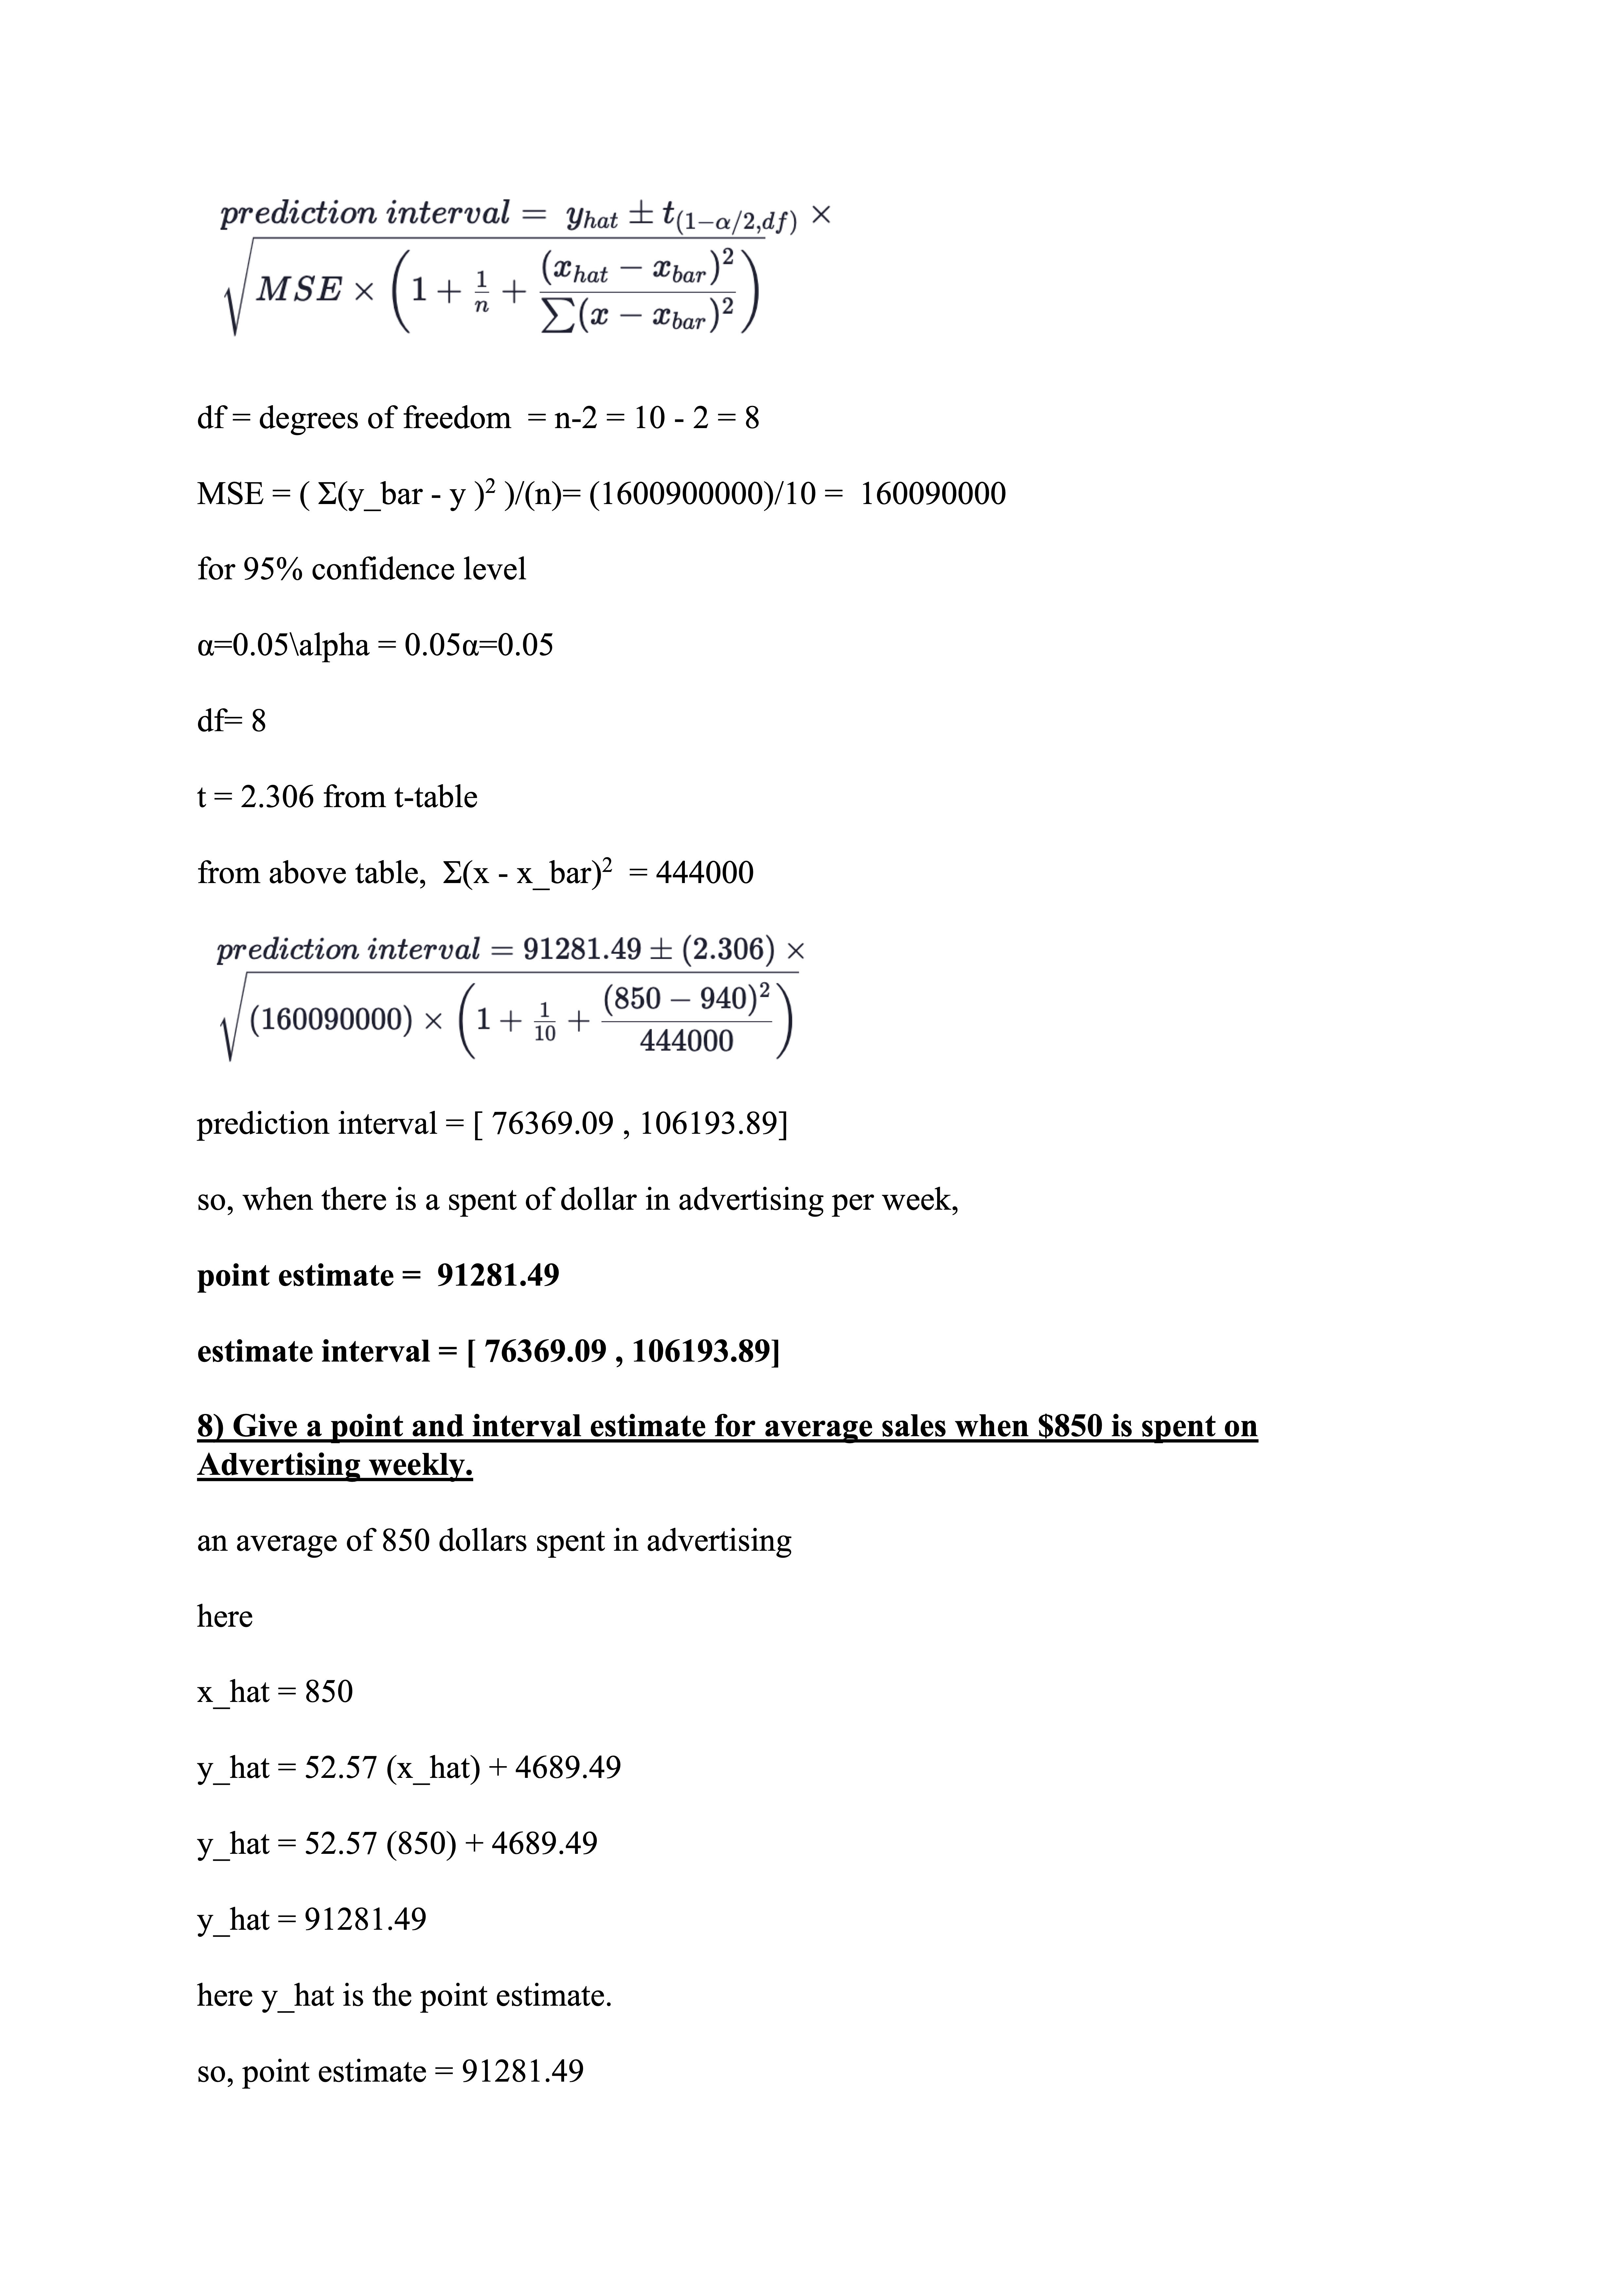
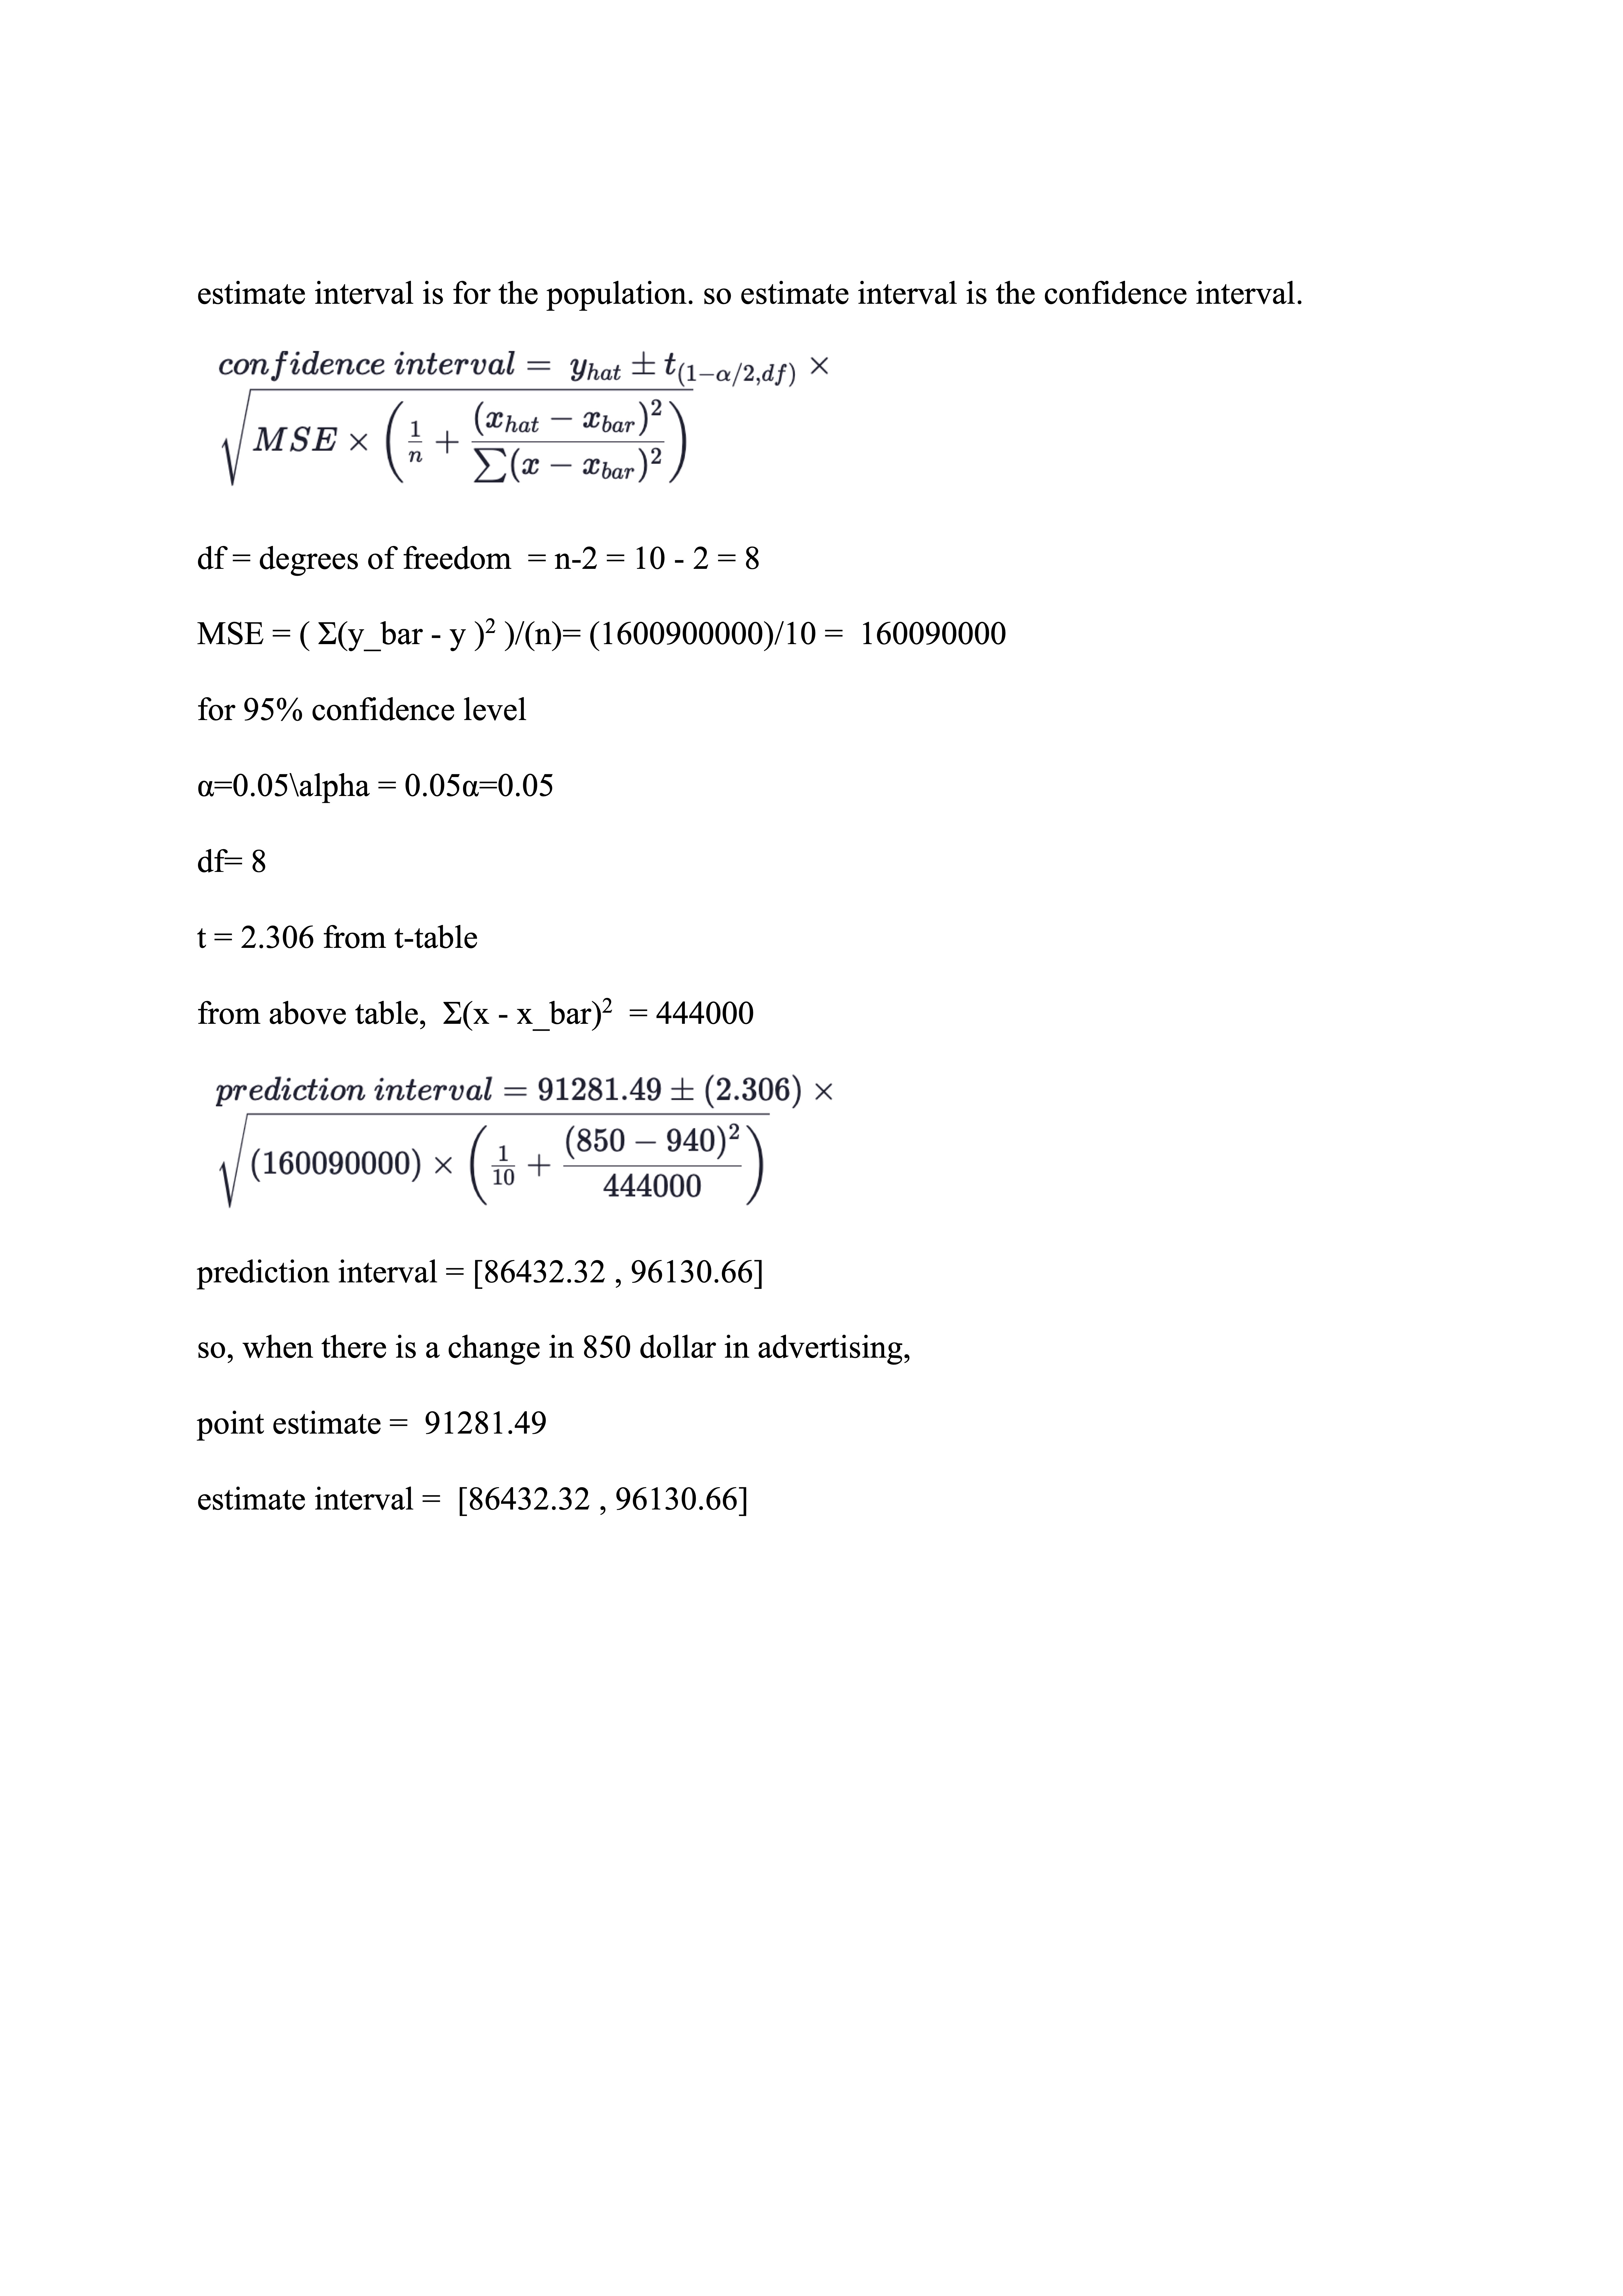
4) What proportion of the change in Sales can be explained by changes in Advertising? advertising (x) sales(y) x^2 y1 2 xy x_bar y_bar y_cap (y_bar-y) 2 (y_cap -y)2 ( x_bar-x) 2 1200 101000 1440000 10201000000 121200000 940 95900 109570.5 26010000 73453298.84 6 800 92000 640000 8464000000 73600000 940 95900 88542.49 15210000 11954375.4 19600 1000 110000 1000000 12100000000 110000000 940 95900 99056.49 198810000 119760411.1 3600 1300 120000 1690000 14400000000 156000000 940 95900 114827.5 580810000 26754859.7 129600 700 90000 490000 8100000000 63000000 940 95900 83285.49 34810000 45084644.54 57600 800 32000 640000 6724000000 65600000 940 95900 88542.49 193210000 42804175.4 19600 1000 93000 1000000 8649000000 93000000 940 95900 99056.49 841000 36681071.12 3600 600 75000 360000 5625000000 45000000 940 95900 78028.49 436810000 9171751.68 115600 900 91000 810000 8281000000 81900000 940 95900 93799.49 24010000 7837144.26 1600 1100 105000 1210000 11025000000 115500000 940 95900 104313.5 82810000 471295.9801 25600 total sum 9400 959000 9280000 93569000000 924800000 540644.5 1600900000 373973028 444000 y_bar = average of sales(y) y_cap = y values of regression equation when advertising(x) values are substituted in regression equation x_bar = average values of advertising(x) sum squared regression (SSR) = E(y - y_cap)2 = 373973028 total sum of squares (SST) = E(y_bar - y )2 = 1600900000 R2 = 1 - SSR SST =1 - 373973028 1600900000 = 0.7664 = 76.64 so, 76.64% (or 0.7764) proportion of the change in Sales can be explained by changes in Advertising 5 How closely correlated are Sales and Advertising? correlation coefficient (r) r = (n) (Exy) -(Ex). (Zy) (10) (924800000)-(9400) (959000) VI(n) (Ex?)-(Ex)?] [(n)(Zy2)-(Zy)2] VI(10)(9280000)-(9400)2][(10)(93569000000)-(959000)2] 0.87544correlation coefficient is 0.87544 which is high value so, the sale and advertisements are closely correlated with correlation coefficient of 0.87544 6) Give a point and interval estimate for the change in Sales per extra Advertising dollar. for 1 dollar change in advertising here x_hat = 1 y_hat = 52.57 (x_hat) + 46484.49 y_hat = 52.57 (1) + 46486.49 y_hat = 46539.06 here y_hat is the point estimate. so, point estimate = 46539.06 estimate interval is for the sample. so estimate interval is the prediction interval. prediction interval = yhat I t(1-a/2,df) X MSEx 1+1 + (That - bar)2 E(x - Xbar)2 df = degrees of freedom = n-2 = 10 - 2 = 8 MSE = (Z(y_bar - y )2 )/(n)= (1600900000)/10 = 160090000 for 95% confidence level a=0.05\\alpha = 0.05a=0.05 df= 8 t = 2.306 from t-tablefrom above table, E(x - x_bar)2 = 444000 prediction interval = 46539.06 + (2.306) x (160090000) x (1+ + (1-940)2 444000 prediction interval = [ 21766.83 , 71311.55 ] so, when there is a change in 1 dollar in advertising, point estimate = 46539.06 estimate interval = [ 21766.83 , 71311.55 ] 7) . Give a point and interval estimate for Sales in a week in which $850 was spent on Advertising. for 850 dollars spent in advertsing here x hat = 850 y_hat = 52.57 (x_hat) + 4689.49 y_hat = 52.57 (850) + 4689.49 y_hat = 91281.49 here y_hat is the point estimate. so, point estimate = 91281.49 estimate interval is for the sample. so estimate interval is the prediction interval.prediction interval = yhat I t(1-a/2,df) X MSE x 1+ 1 + (That -bar)2 E(x - xbar)2 df = degrees of freedom = n-2 = 10 - 2 = 8 MSE = ( Z(y_bar - y )2 )/(n)= (1600900000)/10 = 160090000 for 95% confidence level a=0.05\\alpha = 0.05a=0.05 df= 8 t = 2.306 from t-table from above table, E(x - x_bar) = 444000 prediction interval = 91281.49 + (2.306) x (160090000) x 1+ + (850 - 940)2 444000 prediction interval = [ 76369.09 , 106193.89] so, when there is a spent of dollar in advertising per week, point estimate = 91281.49 estimate interval = [ 76369.09 , 106193.89] 8) Give a point and interval estimate for average sales when $850 is spent on Advertising weekly. an average of 850 dollars spent in advertising here x_hat = 850 y_hat = 52.57 (x_hat) + 4689.49 y_hat = 52.57 (850) + 4689.49 y_hat = 91281.49 here y_hat is the point estimate. so, point estimate = 91281.49estimate interval is for the population. so estimate interval is the confidence interval. confidence interval = yhat I t(1-a/2,df) X MSE x 1 + (That - bar)2 E(x - Xbar)2 df = degrees of freedom = n-2 = 10 - 2 = 8 MSE = ( Z(y_bar - y )2 )/(n)= (1600900000)/10 = 160090000 for 95% confidence level a=0.05 \\alpha = 0.05a=0.05 df= 8 t = 2.306 from t-table from above table, E(x - x_bar)2 = 444000 prediction interval = 91281.49 + (2.306) x (160090000) x 16 + (850 - 940)? 444000 prediction interval = [86432.32 , 96130.66] so, when there is a change in 850 dollar in advertising, point estimate = 91281.49 estimate interval = [86432.32 , 96130.66]
Step by Step Solution
There are 3 Steps involved in it
Step: 1
Get Instant Access to Expert-Tailored Solutions
See step-by-step solutions with expert insights and AI powered tools for academic success
Step: 2
Step: 3
Ace Your Homework with AI
Get the answers you need in no time with our AI-driven, step-by-step assistance